Fig. 12
Download original image
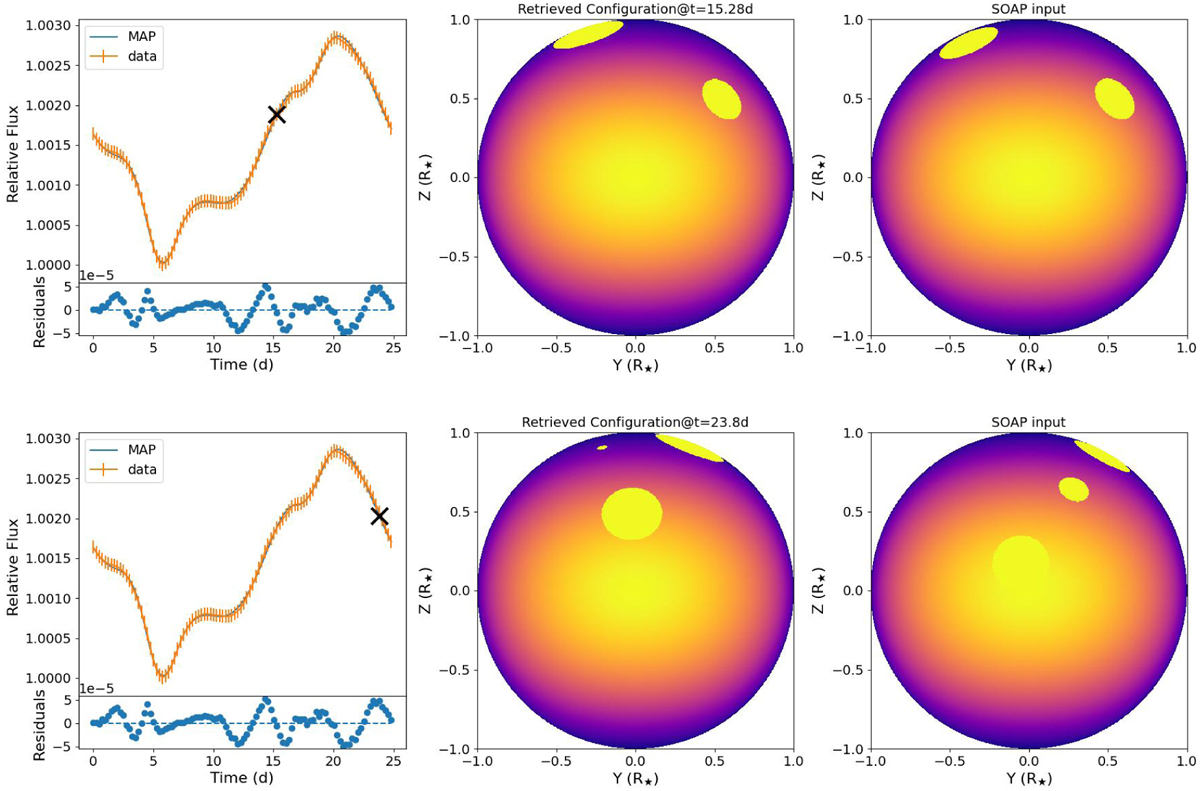
Comparison between best-fit (MAP) model of the four-facula configuration versus input SOAP configuration. Left panels: best-fit photometric light curve presented as blue line; SOAP synthetic light curve shown as orange line with its errors, obtained by adding in quadrature data errors and jitter. A black cross marks the time at which the model (middle) and input SOAP (right) facula configurations are shown. Stellar flux is colour-coded as in Fig. 1, with the exception of the facula flux that has been modified to 103 in order to enhance the visibility.
Current usage metrics show cumulative count of Article Views (full-text article views including HTML views, PDF and ePub downloads, according to the available data) and Abstracts Views on Vision4Press platform.
Data correspond to usage on the plateform after 2015. The current usage metrics is available 48-96 hours after online publication and is updated daily on week days.
Initial download of the metrics may take a while.