Fig. 1
Download original image
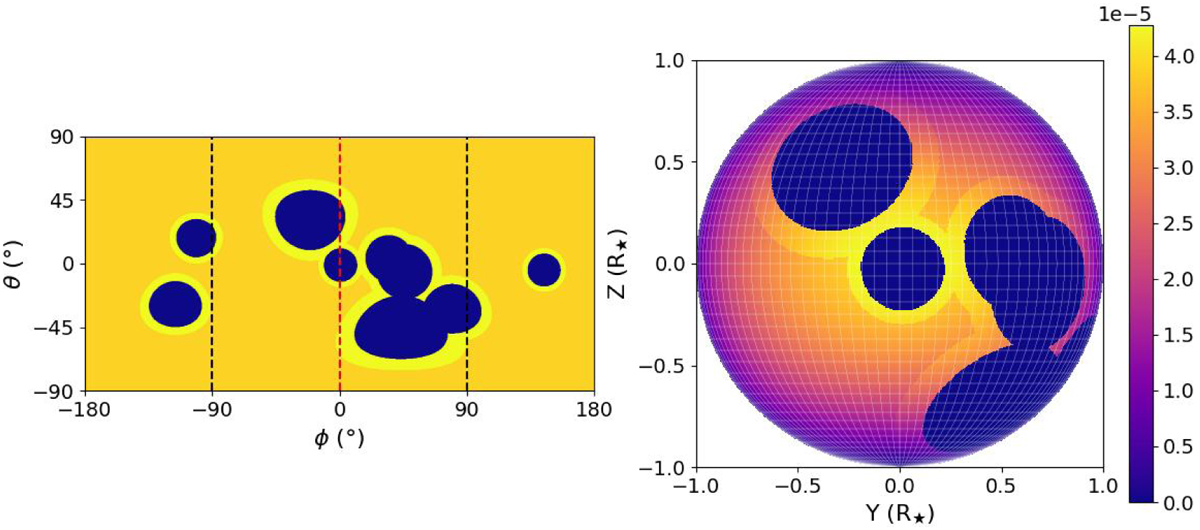
Configuration of inhomogeneities on stellar surface. Left: flux on latitude–longitude (θ − ϕ) domain colour-coded and ranging from 0 (in dark violet, corresponding to the presence spots) and 1 (in orange, corresponding to the photosphere), to 1.1 (in bright yellow, corresponding to the presence of faculae). A dashed red line marks the centre of the visible disc, while the two adjacent dashed black lines mark the boundary of the observed disc. Right: projection of left mask in the visible disc in which the colour of each surface element accounts for the (left) flux and the pixel area, but not for the limb darkening. White lines mark a low resolution spherical grid of 3.6°, which is ten times lower than the actual grid spacing.
Current usage metrics show cumulative count of Article Views (full-text article views including HTML views, PDF and ePub downloads, according to the available data) and Abstracts Views on Vision4Press platform.
Data correspond to usage on the plateform after 2015. The current usage metrics is available 48-96 hours after online publication and is updated daily on week days.
Initial download of the metrics may take a while.