Fig. 9.
Download original image
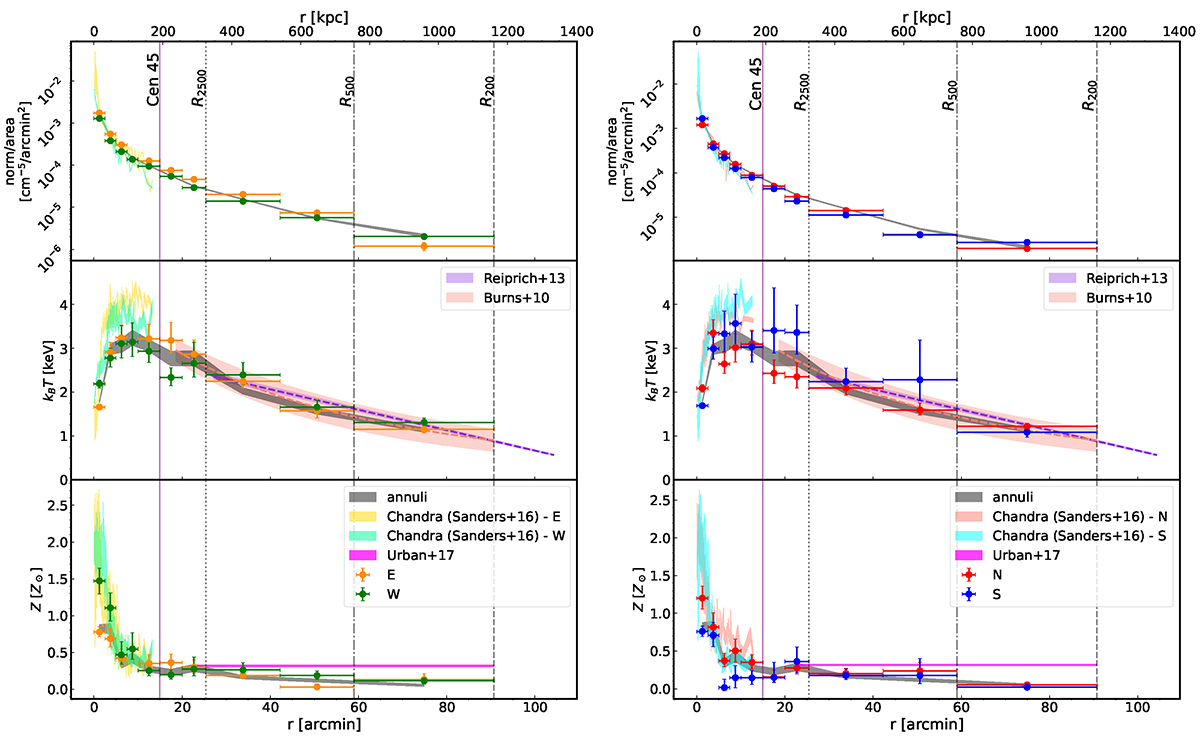
Spectral parameter profiles of the Centaurus cluster constrained from eRASS:5 data. Left: eastern (orange data points) and western (green) profiles. Right: northern (red) and southern (blue) profiles. In each panel we show the normalization per unit area (top), gas temperature (middle), and metallicity (bottom) plots. The full azimuthal profile of each parameter is shown as the gray shaded area. In the temperature panels (middle), we plot the Suzaku cluster temperature fit (purple shaded area; Reiprich et al. 2013) and the average two-dimensional cluster profile from simulations (pink shaded area; Burns et al. 2010). In the metallicity panels (bottom), the average metallicity measurements reported by Urban et al. (2017) for r > 0.25R200, ZFe = 0.316 ± 0.012 Solar, is indicated by the magenta shaded area.
Current usage metrics show cumulative count of Article Views (full-text article views including HTML views, PDF and ePub downloads, according to the available data) and Abstracts Views on Vision4Press platform.
Data correspond to usage on the plateform after 2015. The current usage metrics is available 48-96 hours after online publication and is updated daily on week days.
Initial download of the metrics may take a while.