Fig. 7.
Download original image
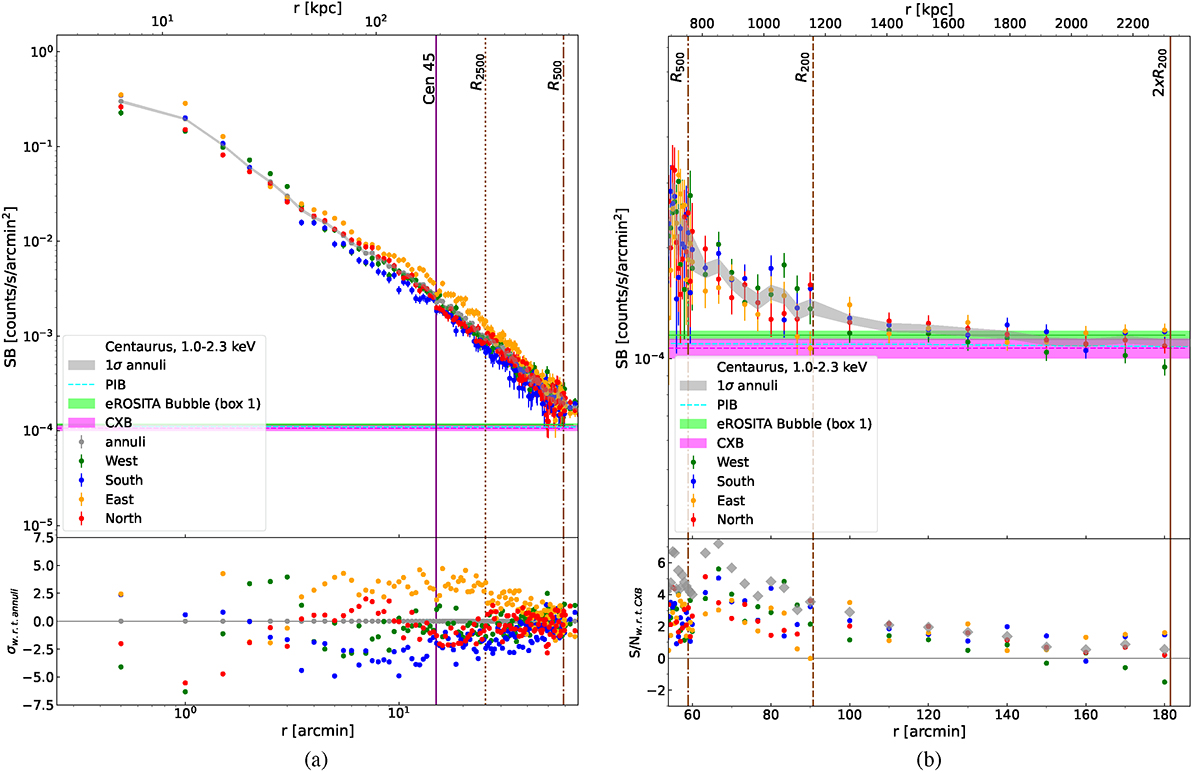
Particle-induced background-subtracted surface brightness profiles of the Centaurus cluster in the 1.0 − 2.3 keV band are shown in the top panel in each plot. The different sectors are indicated with different colors. The CXB level and its 1σ standard deviation are shown as magenta dashed lines and shaded areas, while the PIB levels are indicated by the cyan dashed lines. The eROSITA Bubble emission calculated from box 1 (see Fig. 2) is marked by the green shaded area. The bottom panels show the significance with respect to the full azimuthal surface brightness profile (σw.r.t.annuli) and the CXB level (S/Nw.r.t.CXB). (a) 0 ≤ r ≤ R500, (b) R500 ≤ r ≤ 2R200.
Current usage metrics show cumulative count of Article Views (full-text article views including HTML views, PDF and ePub downloads, according to the available data) and Abstracts Views on Vision4Press platform.
Data correspond to usage on the plateform after 2015. The current usage metrics is available 48-96 hours after online publication and is updated daily on week days.
Initial download of the metrics may take a while.