Fig. 2.
Download original image
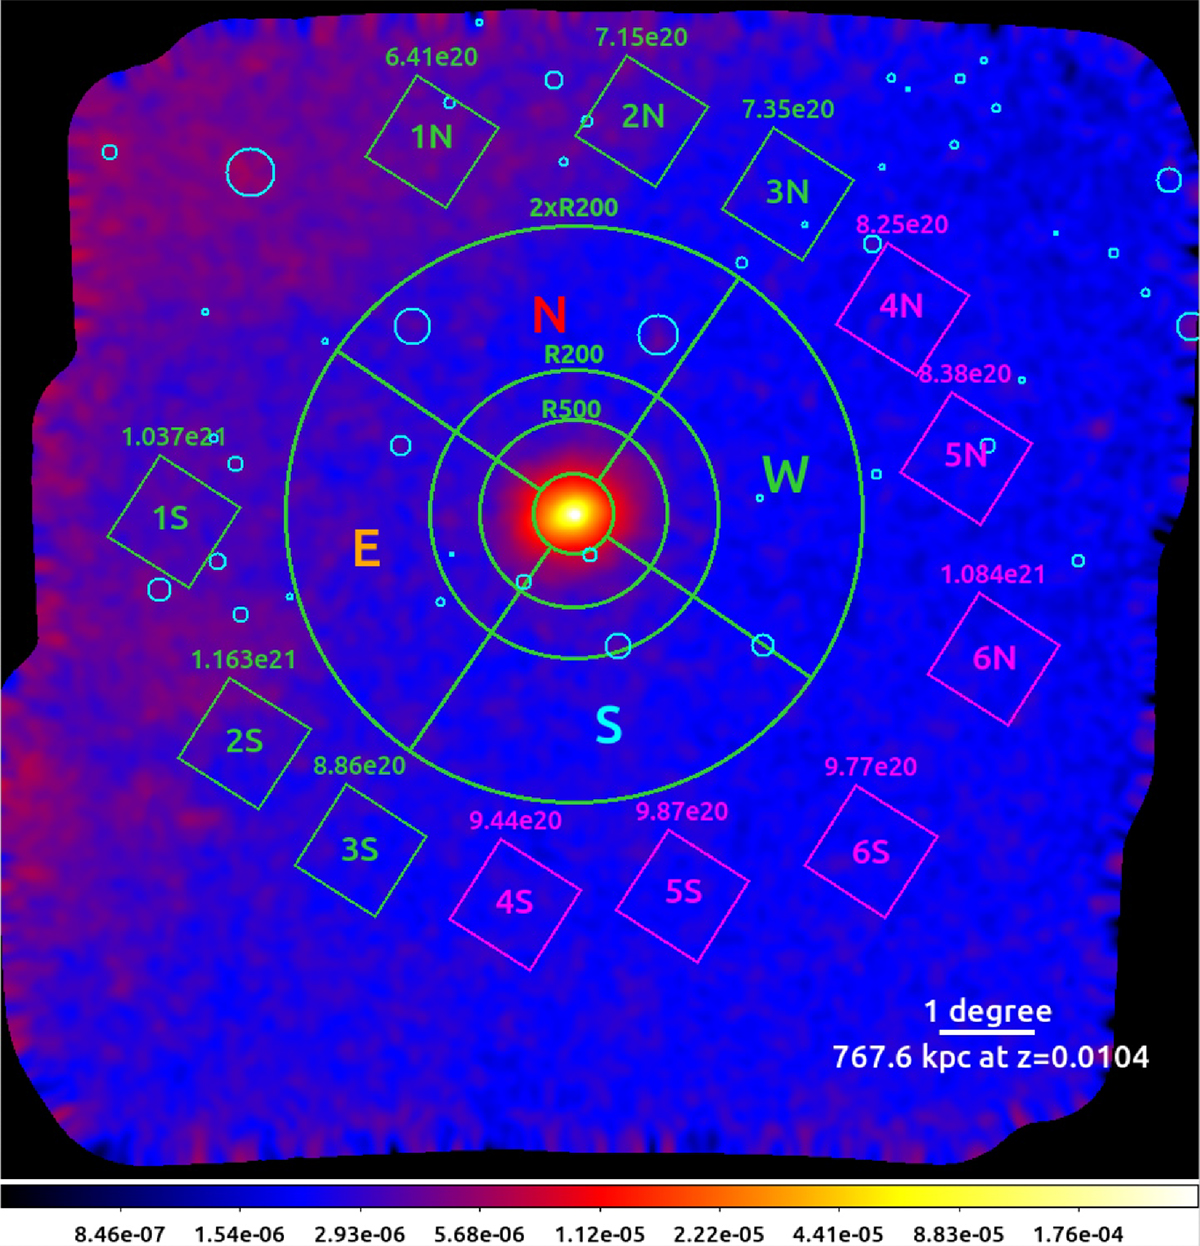
eRASS:5 fully corrected image in the 0.2 − 2.3 keV band. The image has been adaptively smoothed with S/N set to 45 (see Sect. 2.1). The green concentric circles are the characteristic radii of the Centaurus cluster and the four sectors used in the analyses are labeled. The boxes outside 2R200 are used for the CXB analysis described in Sect. 2.3, as a result we decided to use the magenta boxes for CXB region for our science analyses. The values above the boxes are their median NH values in atoms cm−2. The cyan circles are the eRASS1 background clusters as shown in Fig. 1. In this image the emission from these clusters, as well as other unrelated sources have been removed and refilled.
Current usage metrics show cumulative count of Article Views (full-text article views including HTML views, PDF and ePub downloads, according to the available data) and Abstracts Views on Vision4Press platform.
Data correspond to usage on the plateform after 2015. The current usage metrics is available 48-96 hours after online publication and is updated daily on week days.
Initial download of the metrics may take a while.