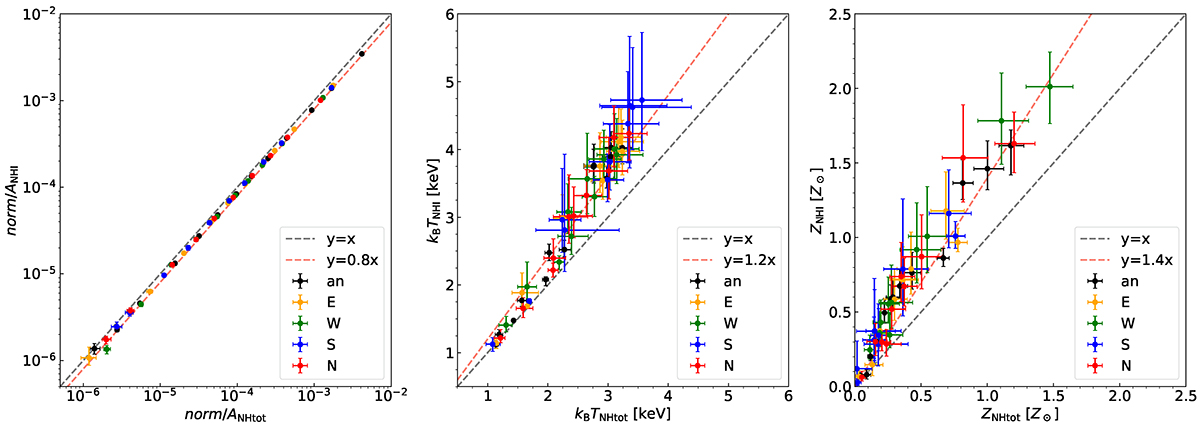
Fig. D.1.
Download original image
Comparison plots of the different spectral parameters of the Centaurus cluster constrained from eRASS:5 spectra. The spectra were fit using different absorption values, as discussed in Sect. 3.4. The y-axes represent values obtained using the neutral hydrogen column density (NHI), while the x-axes from the total hydrogen column density (NHtot). Gray dashed lines indicate the 1:1 ratio, and the orange dashed lines represent offset lines, as detailed in the legends.
Current usage metrics show cumulative count of Article Views (full-text article views including HTML views, PDF and ePub downloads, according to the available data) and Abstracts Views on Vision4Press platform.
Data correspond to usage on the plateform after 2015. The current usage metrics is available 48-96 hours after online publication and is updated daily on week days.
Initial download of the metrics may take a while.