Open Access
Fig. 8.
Download original image
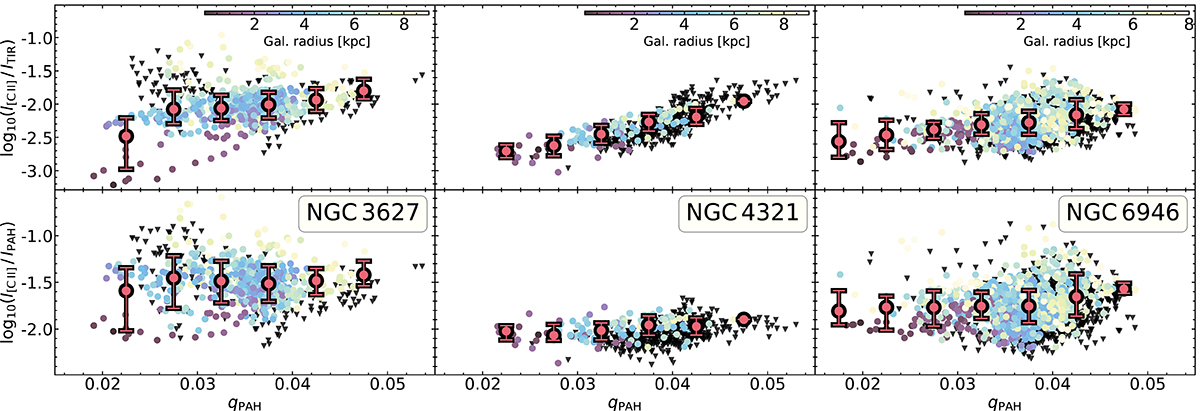
[C II]/CO(1−0) and [C II]/PAH line ratios as a function of qPAH, colour-coded by radius. Grey triangles represent points of upper limits where [C II] S/N < 3. Solid circles represent measurements for points where [C II] S/N ≥ 3. Large circles show means of bins with ±1σ error.
Current usage metrics show cumulative count of Article Views (full-text article views including HTML views, PDF and ePub downloads, according to the available data) and Abstracts Views on Vision4Press platform.
Data correspond to usage on the plateform after 2015. The current usage metrics is available 48-96 hours after online publication and is updated daily on week days.
Initial download of the metrics may take a while.