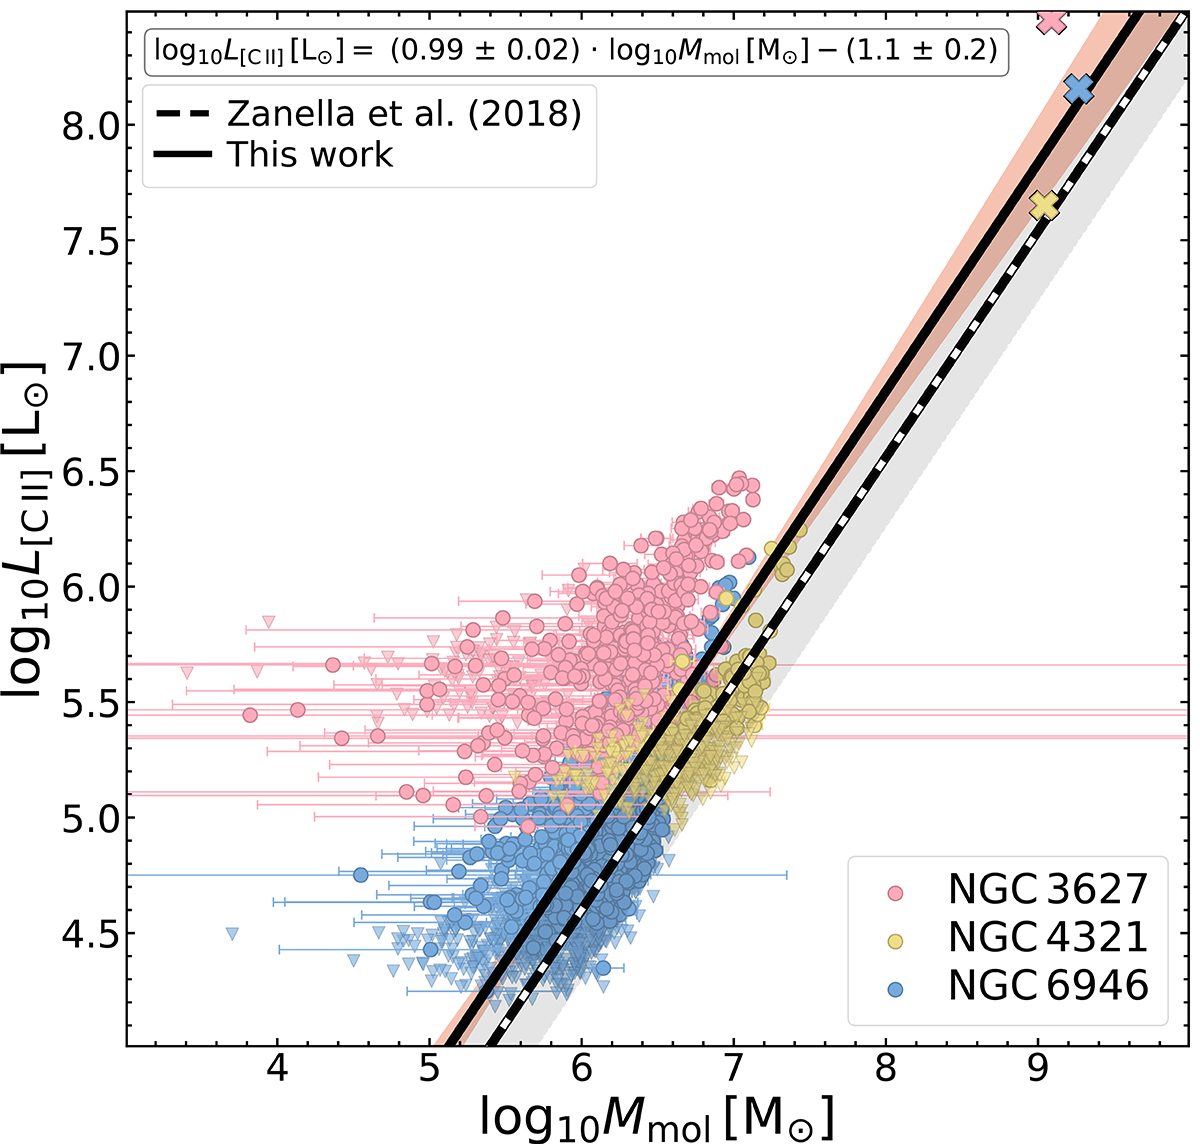
Fig. 6.
Download original image
[C II] luminosity as a function of Mmol for galaxies NGC 3627, NGC 4321, and NGC 6946. Each point covers the half beam distance (0.50 kpc for NGC 3627, 0.67 kpc for NGC 4321, and 0.32 kpc for NGC 6946). Triangles represent points of upper limits, where [C II] S/N < 3, while circles represent actual measurements for points where [C II] S/N ≥ 3, with error bars representing ±1σ uncertainty. The solid black line shows the fit from our dataset, and the red filled area marks the 3-σ error, while the dashed line marks the fit from Eq. (8) (Zanella et al. 2018), along with their standard deviation shaded in grey. Large crosses in the upper-right corner of the plot represent integrated values for L[C II] and Mmol, where [C II] S/N ≥ 3, colour coded by galaxy.
Current usage metrics show cumulative count of Article Views (full-text article views including HTML views, PDF and ePub downloads, according to the available data) and Abstracts Views on Vision4Press platform.
Data correspond to usage on the plateform after 2015. The current usage metrics is available 48-96 hours after online publication and is updated daily on week days.
Initial download of the metrics may take a while.