Fig. 5.
Download original image
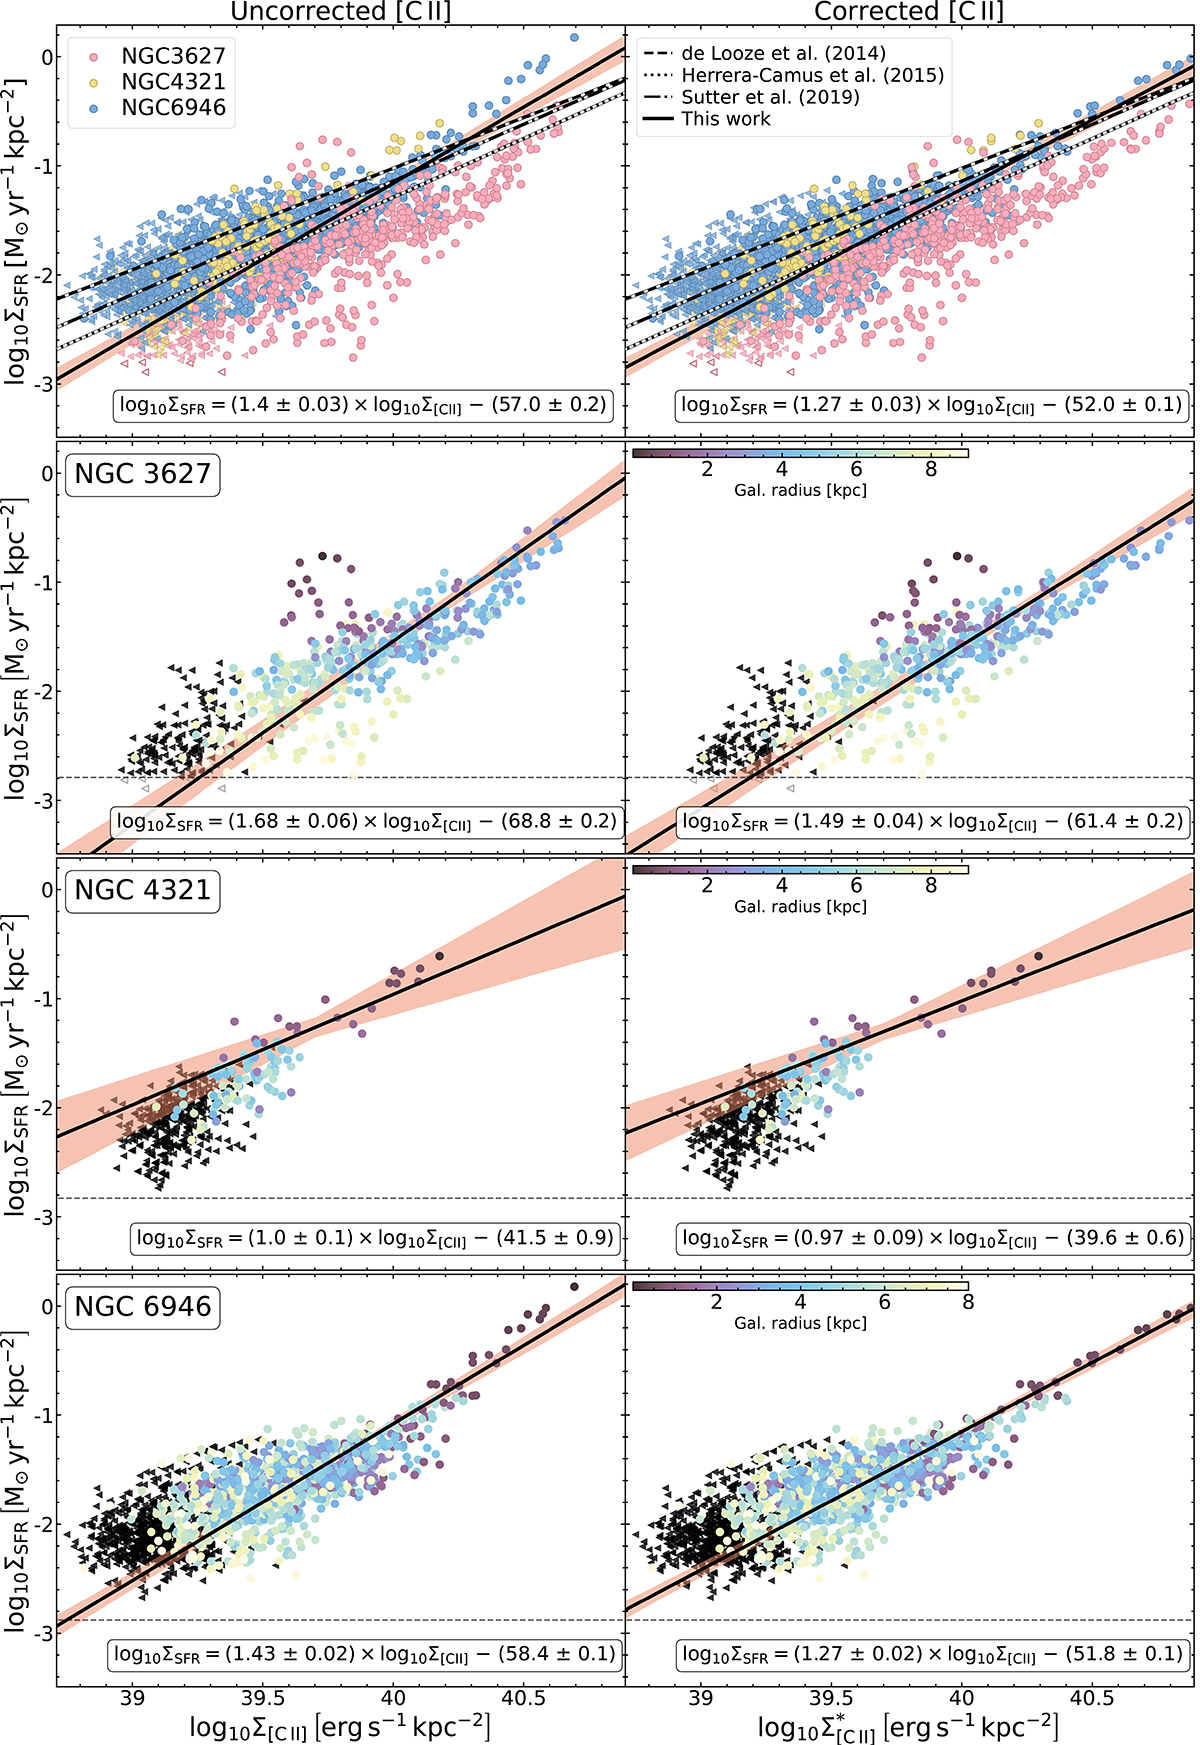
ΣSFR as a function of Σ[C II] (left) or as IR colour-adjusted ![]() , as described by Herrera-Camus et al. (2015) (right). The topmost row shows the fit for the entire dataset, followed by fits for each single galaxy: NGC 3627, NGC 4321, and finally NGC 6946. Each point covers the half beam distance 0.50 kpc for NGC 3627, 0.67 kpc for NGC 4321, and 0.32 kpc for NGC 6946. Triangles represent points of upper limits, while circles represent actual measurements for points where [C II] S/N ≥ 3. Empty points below the dashed horizontal line represent values below 3 × RMS noise for ΣSFR and are not included in the regression analysis. The fit is shown with a solid black line, and the red filled area around it marks the 3-σ error. Dashed, dash dotted, and dotted lines (see legend) show fits from Herrera-Camus et al. (2015), Sutter et al. (2019) (Herschel KINGFISH and Beyond the Peak), and De Looze et al. (2014) (Herschel Dwarf Galaxy Survey).
, as described by Herrera-Camus et al. (2015) (right). The topmost row shows the fit for the entire dataset, followed by fits for each single galaxy: NGC 3627, NGC 4321, and finally NGC 6946. Each point covers the half beam distance 0.50 kpc for NGC 3627, 0.67 kpc for NGC 4321, and 0.32 kpc for NGC 6946. Triangles represent points of upper limits, while circles represent actual measurements for points where [C II] S/N ≥ 3. Empty points below the dashed horizontal line represent values below 3 × RMS noise for ΣSFR and are not included in the regression analysis. The fit is shown with a solid black line, and the red filled area around it marks the 3-σ error. Dashed, dash dotted, and dotted lines (see legend) show fits from Herrera-Camus et al. (2015), Sutter et al. (2019) (Herschel KINGFISH and Beyond the Peak), and De Looze et al. (2014) (Herschel Dwarf Galaxy Survey).
Current usage metrics show cumulative count of Article Views (full-text article views including HTML views, PDF and ePub downloads, according to the available data) and Abstracts Views on Vision4Press platform.
Data correspond to usage on the plateform after 2015. The current usage metrics is available 48-96 hours after online publication and is updated daily on week days.
Initial download of the metrics may take a while.