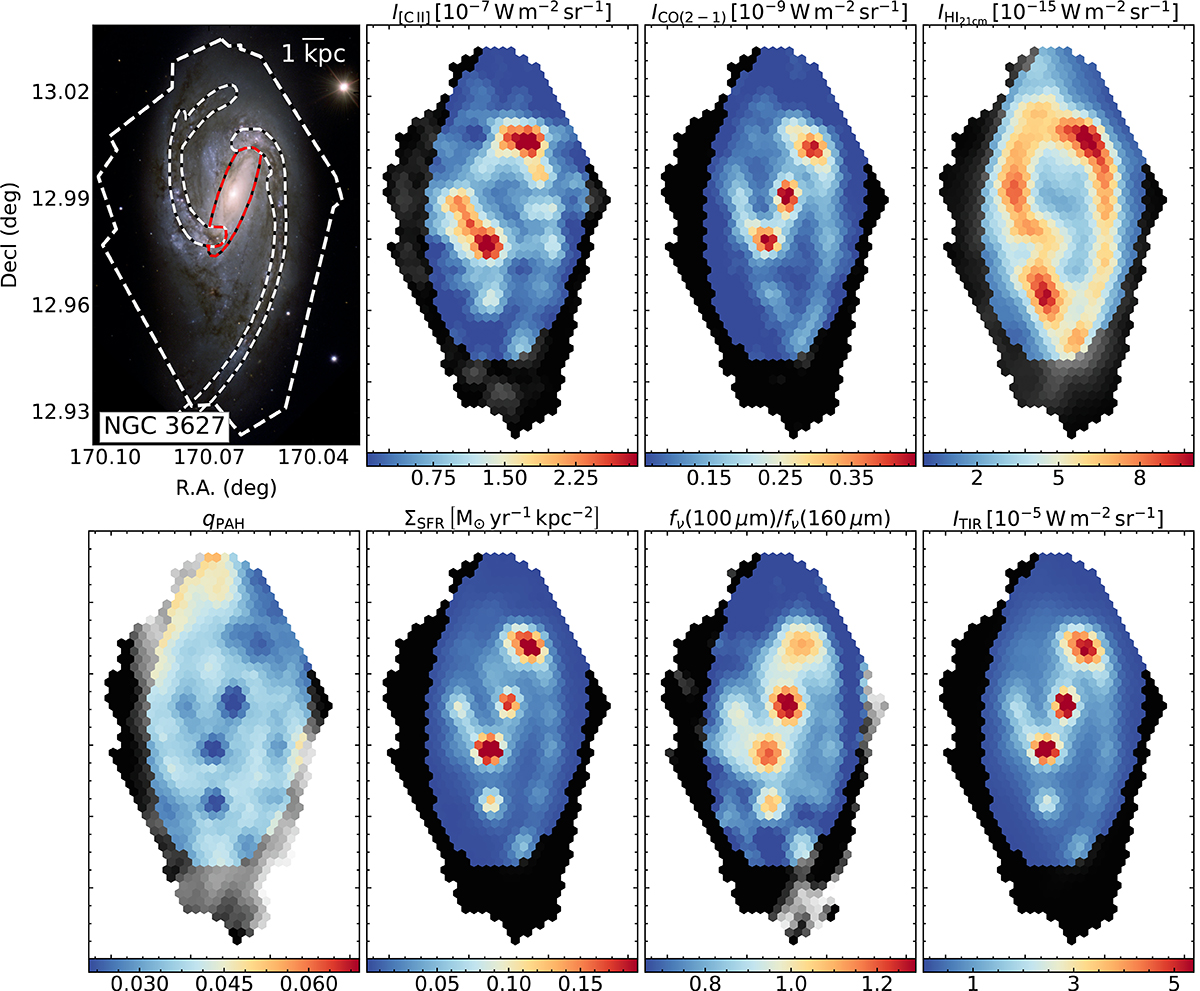
Fig. 1.
Download original image
Full disc maps for galaxy NGC 3627. Top: RGB (image credit: ESO/Pieter Barthel), [C II], CO(2−1), and H I 21-cm integrated intensity maps. Bottom: qPAH, ΣSFR, fν(100 μm)/fν(160 μm) ratio as a tracer of dust temperature and TIR integrated intensity maps for galaxy NGC 3627, all convolved to the resolution of 18.2″. The area in the grey colour scale marks the region outside the maximum considered galactocentric radius (r = 9 kpc) that was not used in the analysis. In the RGB image, the outer white dashed contour outlines the extent of the SOFIA/FIFI-LS observations. Three distinct regions, centre (which consists of the galactic centre and bar), arm, and interarm, are respectively outlined in red and white contours.
Current usage metrics show cumulative count of Article Views (full-text article views including HTML views, PDF and ePub downloads, according to the available data) and Abstracts Views on Vision4Press platform.
Data correspond to usage on the plateform after 2015. The current usage metrics is available 48-96 hours after online publication and is updated daily on week days.
Initial download of the metrics may take a while.