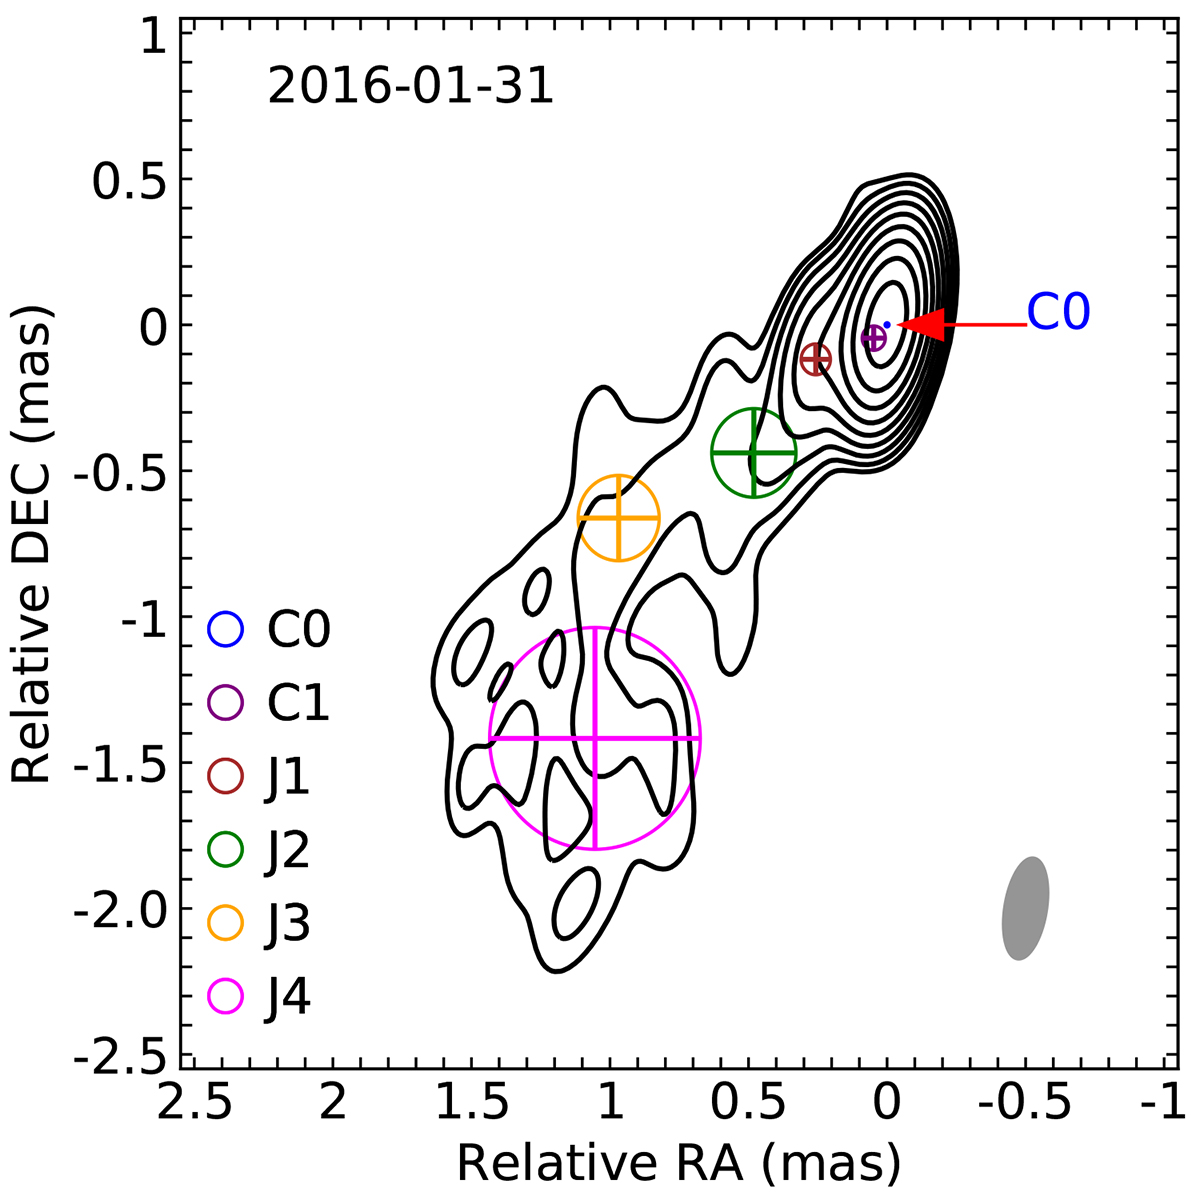
Fig. 9.
Download original image
VLBA 43 GHz image of CTA 102 taken on 2016 January 31. The contours increase by a factor of two from the lowest level of 3.92 mJy beam−1. The map peak is 1.60 Jy beam−1. The grey ellipse in the bottom right corner shows the restoring beam of 0.35 × 0.15 mas at −10 deg. The circles with crosses indicate the positions and sizes of the core (C0) and the jet components (C1 and J1–4).
Current usage metrics show cumulative count of Article Views (full-text article views including HTML views, PDF and ePub downloads, according to the available data) and Abstracts Views on Vision4Press platform.
Data correspond to usage on the plateform after 2015. The current usage metrics is available 48-96 hours after online publication and is updated daily on week days.
Initial download of the metrics may take a while.