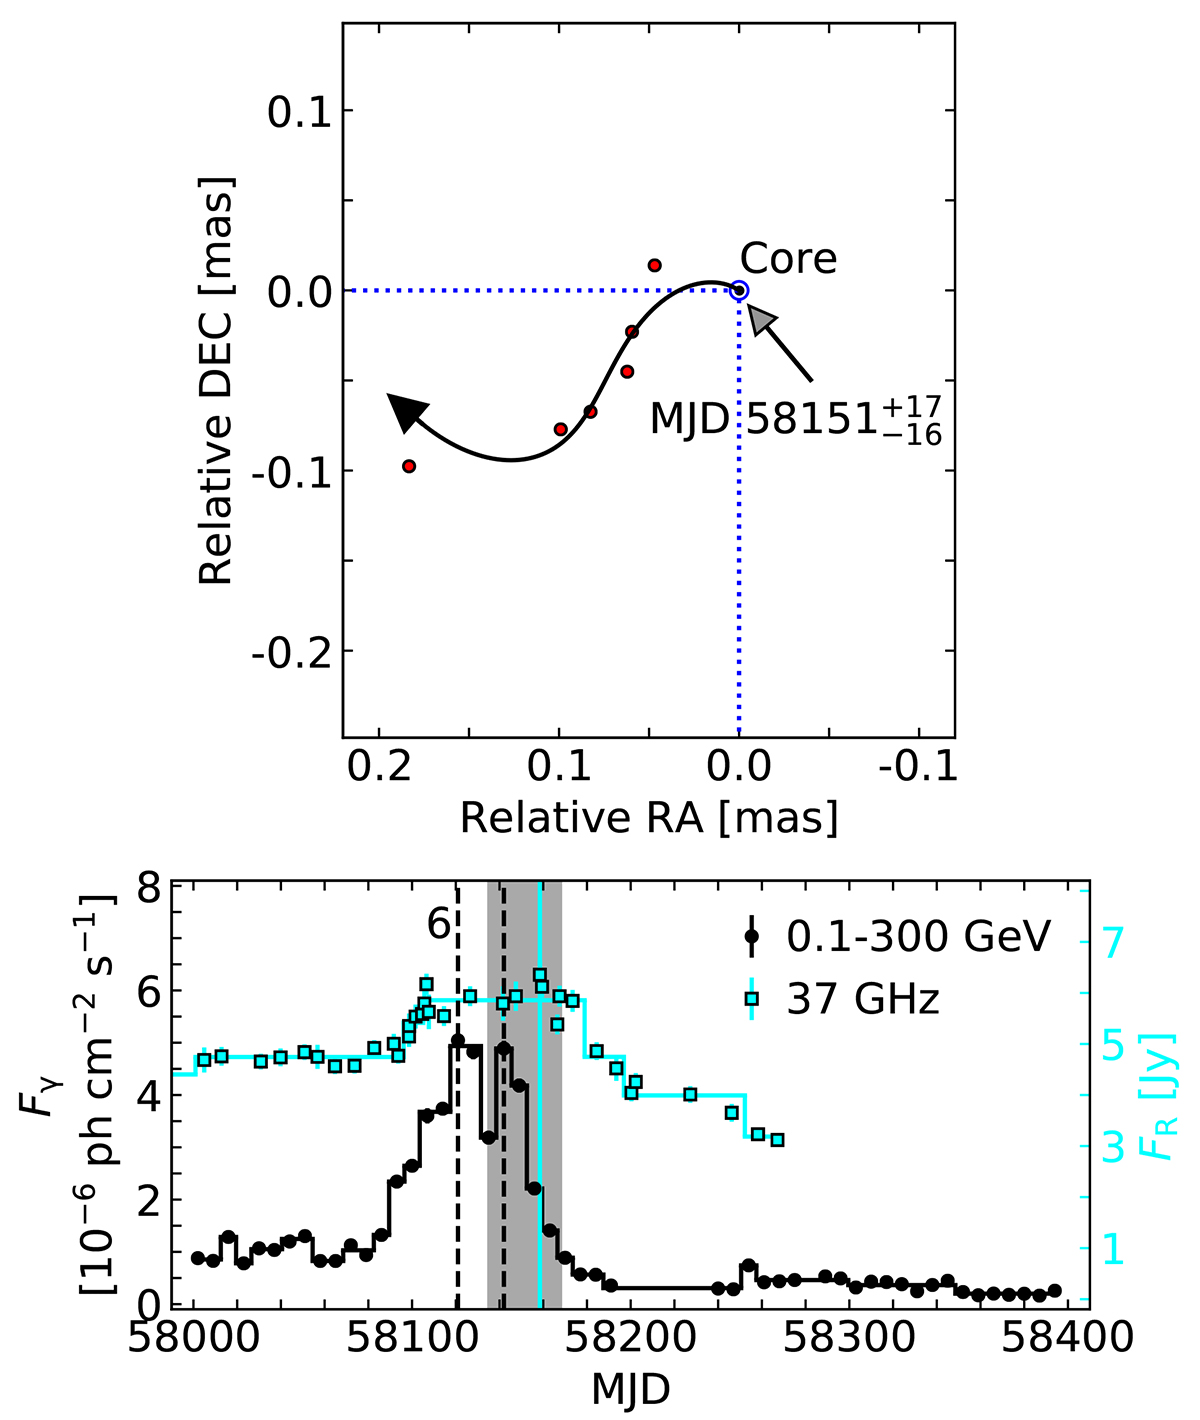
Fig. 13.
Download original image
Motion and position of C3 relative to the core, with γ-ray and radio light curves during the flaring period. Top: same as Fig. 12 for the jet component C3. The grey arrow indicates the ejection position of C3. Bottom: γ-ray (black) and 37 GHz (cyan) light curves during P3 (MJD 58000–58400). The black and cyan solid lines represent the Bayesian blocks of the γ-ray and 37 GHz light curves, respectively. The black vertical dashed lines indicate peaks of two γ-ray local maxima (including Flare 6) in the Bayesian block analysis. The cyan vertical line denotes the peak of the 37 GHz flux density. The shaded grey region shows the ejection of C3.
Current usage metrics show cumulative count of Article Views (full-text article views including HTML views, PDF and ePub downloads, according to the available data) and Abstracts Views on Vision4Press platform.
Data correspond to usage on the plateform after 2015. The current usage metrics is available 48-96 hours after online publication and is updated daily on week days.
Initial download of the metrics may take a while.