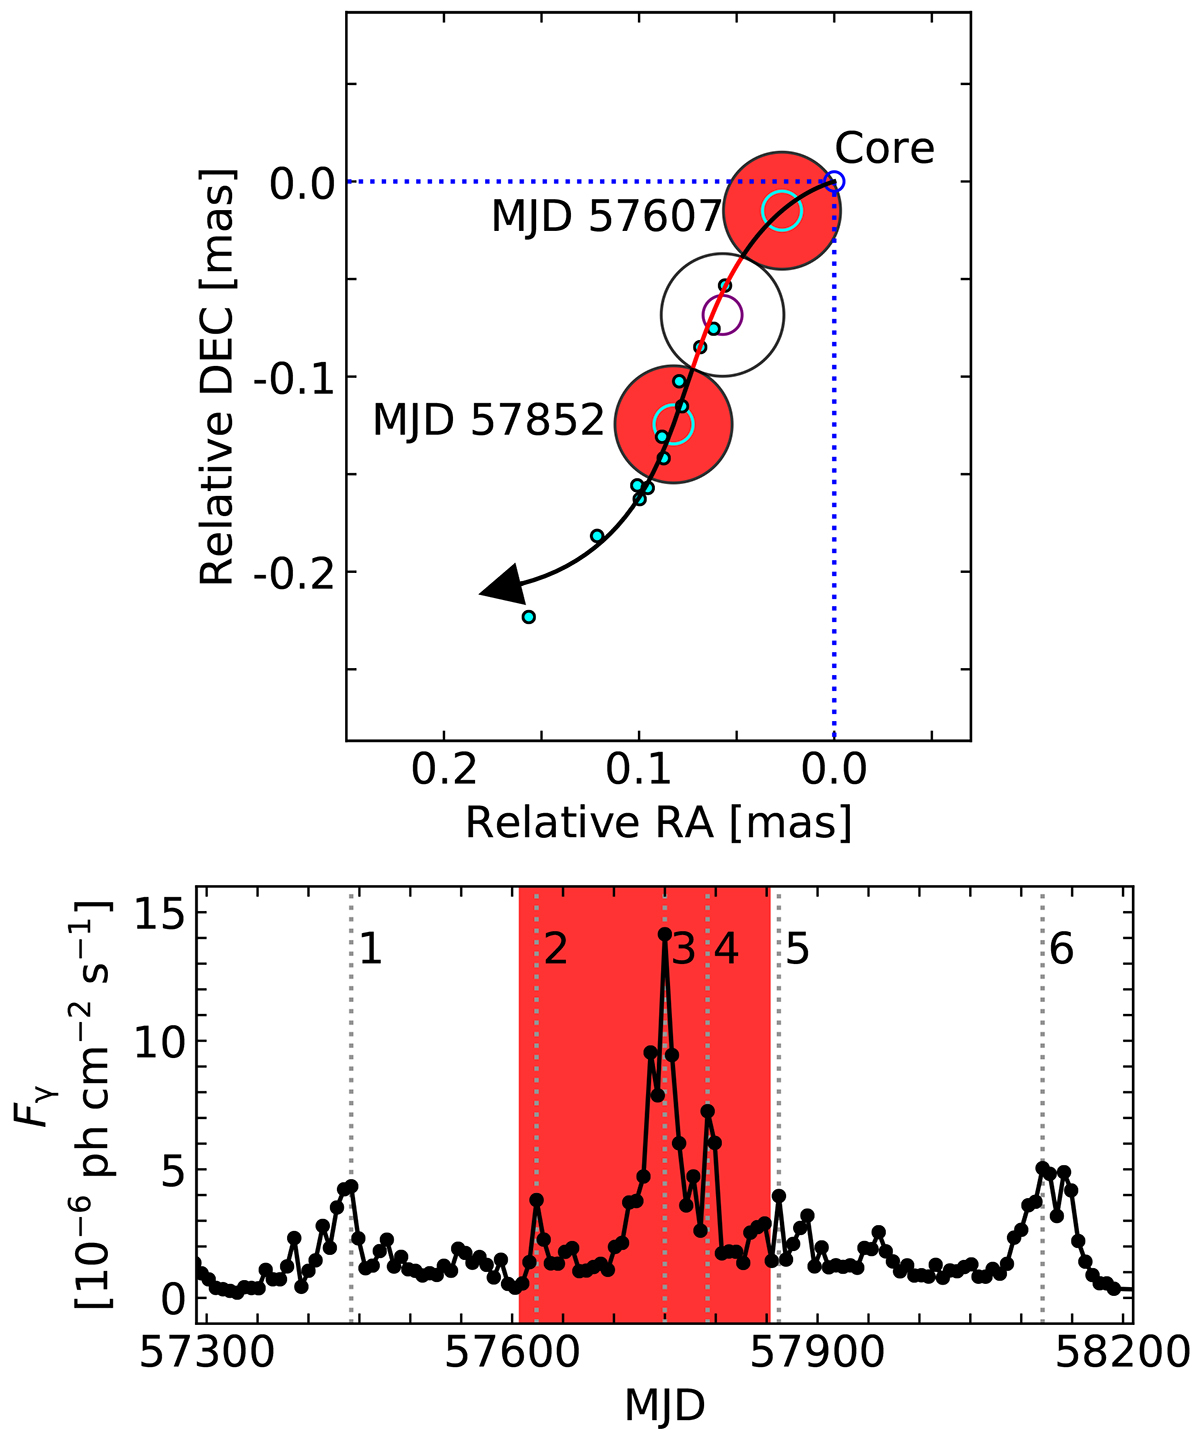
Fig. 12.
Download original image
Motion and position of C2 relative to the core, with γ-ray light curve during the flaring period. Top: vector motion fit and sky position of C2. The position of C2 is relative to the core, denoted by the blue dotted lines. The black solid line represents the vector fit to the separation from the core for C2. The position at each epoch is denoted by filled cyan circles while the positions inferred from the motion of C2 are shown with unfilled large cyan circles. The unfilled purple circle represents the mean separation of C1 from the core. The filled red circles indicate the size of C2 assuming its lower limit, during the period of the shock–shock interaction. The red part in the solid line indicates the interaction region between C1 and C2. Bottom: γ-ray light curve during the flaring period (MJD 57300–58200). The shaded red region represents the period of the interaction between C1 and C2.
Current usage metrics show cumulative count of Article Views (full-text article views including HTML views, PDF and ePub downloads, according to the available data) and Abstracts Views on Vision4Press platform.
Data correspond to usage on the plateform after 2015. The current usage metrics is available 48-96 hours after online publication and is updated daily on week days.
Initial download of the metrics may take a while.