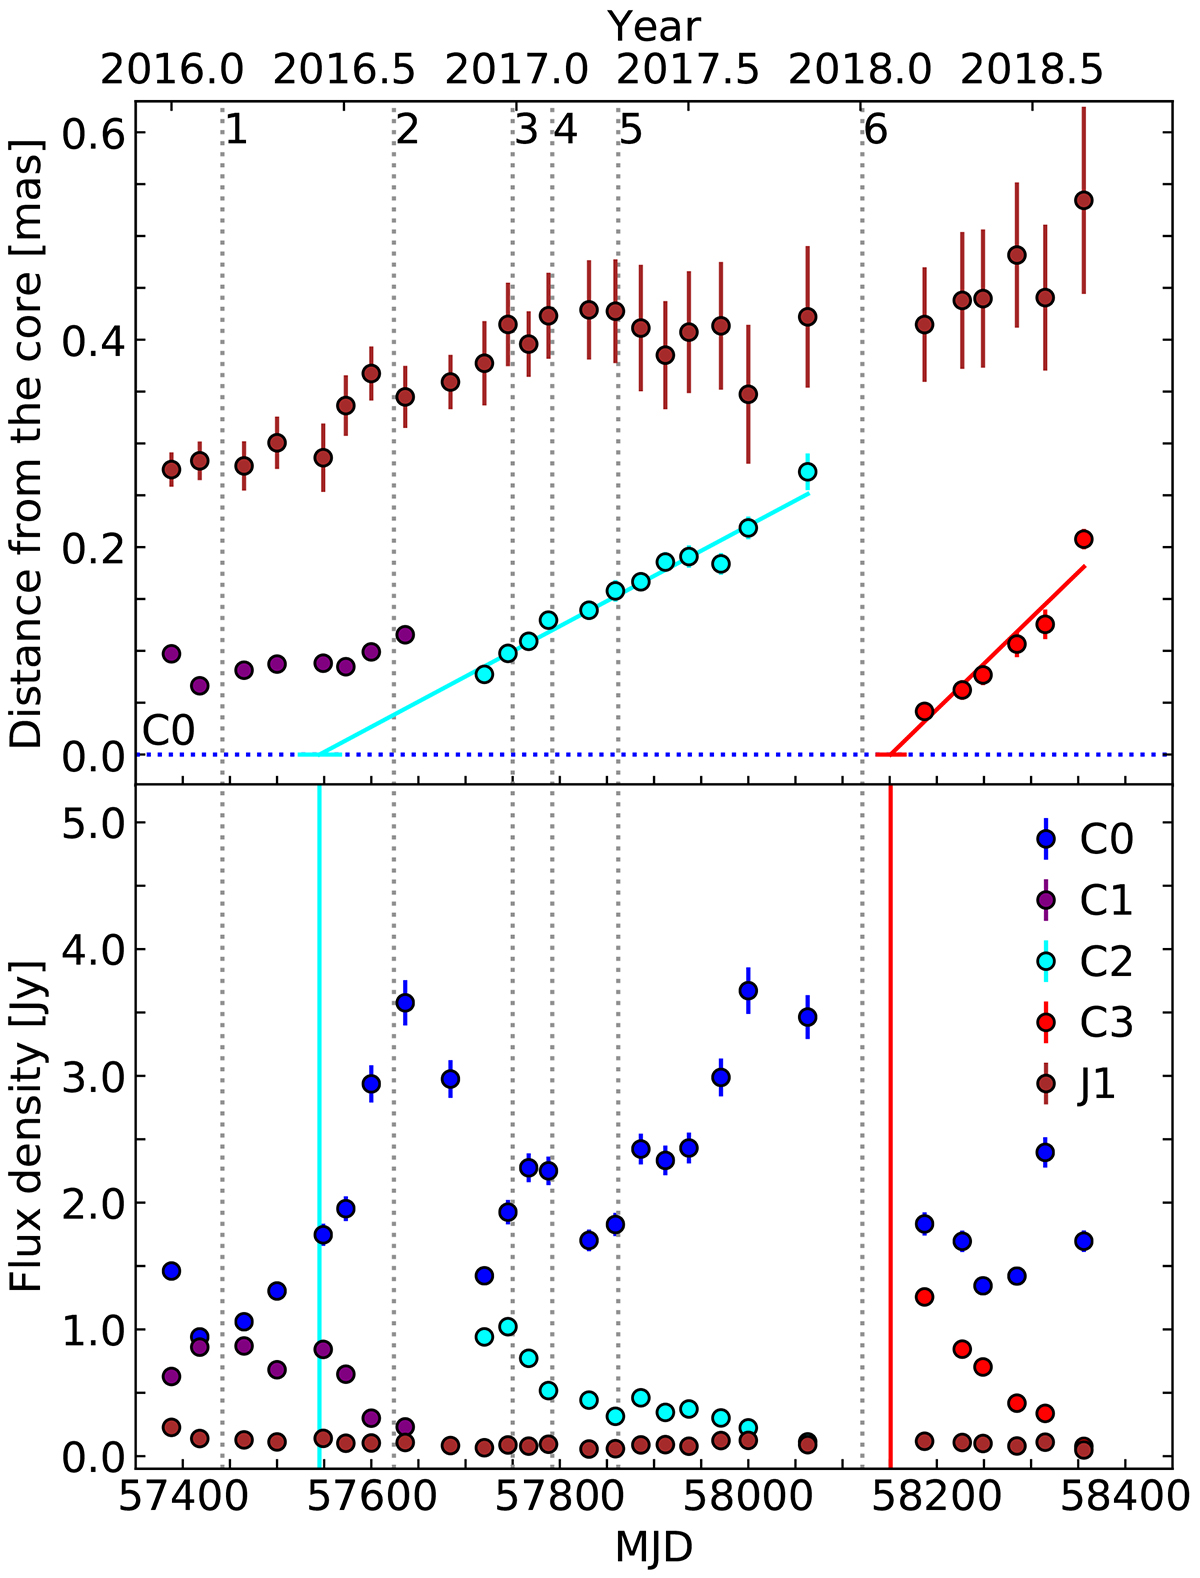
Fig. 10.
Download original image
Kinematics and light curves of the 43 GHz jet components. Top: separations of the jet components from the core (R < 0.5 mas). The grey vertical lines indicate the peaks of the γ-ray flares. The blue dotted line shows the position of C0. The cyan and red solid lines represent linear fits to the positions of C2 and C3, respectively. The cyan and red horizontal lines correspond to the uncertainties in the times of ejection of C2 and C3, respectively. Bottom: Light curves of the 43 GHz core and jet components. The cyan and red vertical lines indicate the ejection times of C2 and C3, respectively.
Current usage metrics show cumulative count of Article Views (full-text article views including HTML views, PDF and ePub downloads, according to the available data) and Abstracts Views on Vision4Press platform.
Data correspond to usage on the plateform after 2015. The current usage metrics is available 48-96 hours after online publication and is updated daily on week days.
Initial download of the metrics may take a while.