Fig. 1.
Download original image
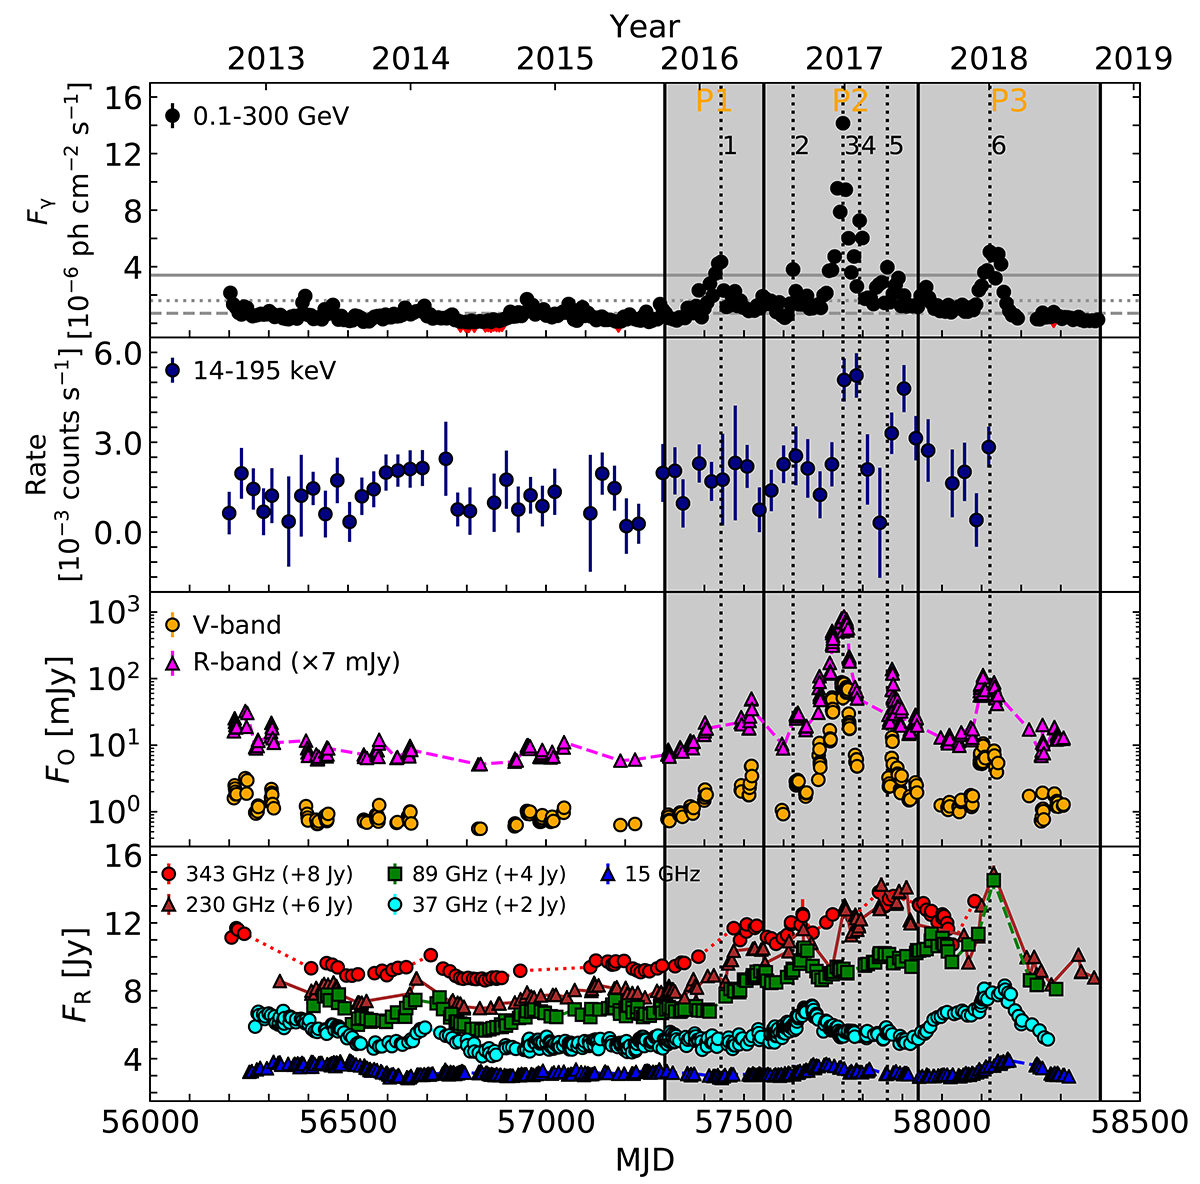
Multi-wavelength light curves from CTA 102. The entire period is from 2012 September 30 to 2018 October 9 (MJD 56200–58400). From top to bottom, the panels show light curves in γ-rays, X-rays, optical, and radio with different colours and symbols indicating different frequencies. The red triangles in the γ-ray light curve indicate upper limits on the flux density. The optical and radio light curves are displayed with arbitrary offsets for clarity. The grey horizontal lines for the γ-ray light curve denote the flux density threshold (see the text for details). The black dotted lines indicate the peaks of the γ-ray flares (1–6). The grey shaded areas mark three periods (P1–3) for the cross-correlation analysis.
Current usage metrics show cumulative count of Article Views (full-text article views including HTML views, PDF and ePub downloads, according to the available data) and Abstracts Views on Vision4Press platform.
Data correspond to usage on the plateform after 2015. The current usage metrics is available 48-96 hours after online publication and is updated daily on week days.
Initial download of the metrics may take a while.