Fig. 7
Download original image
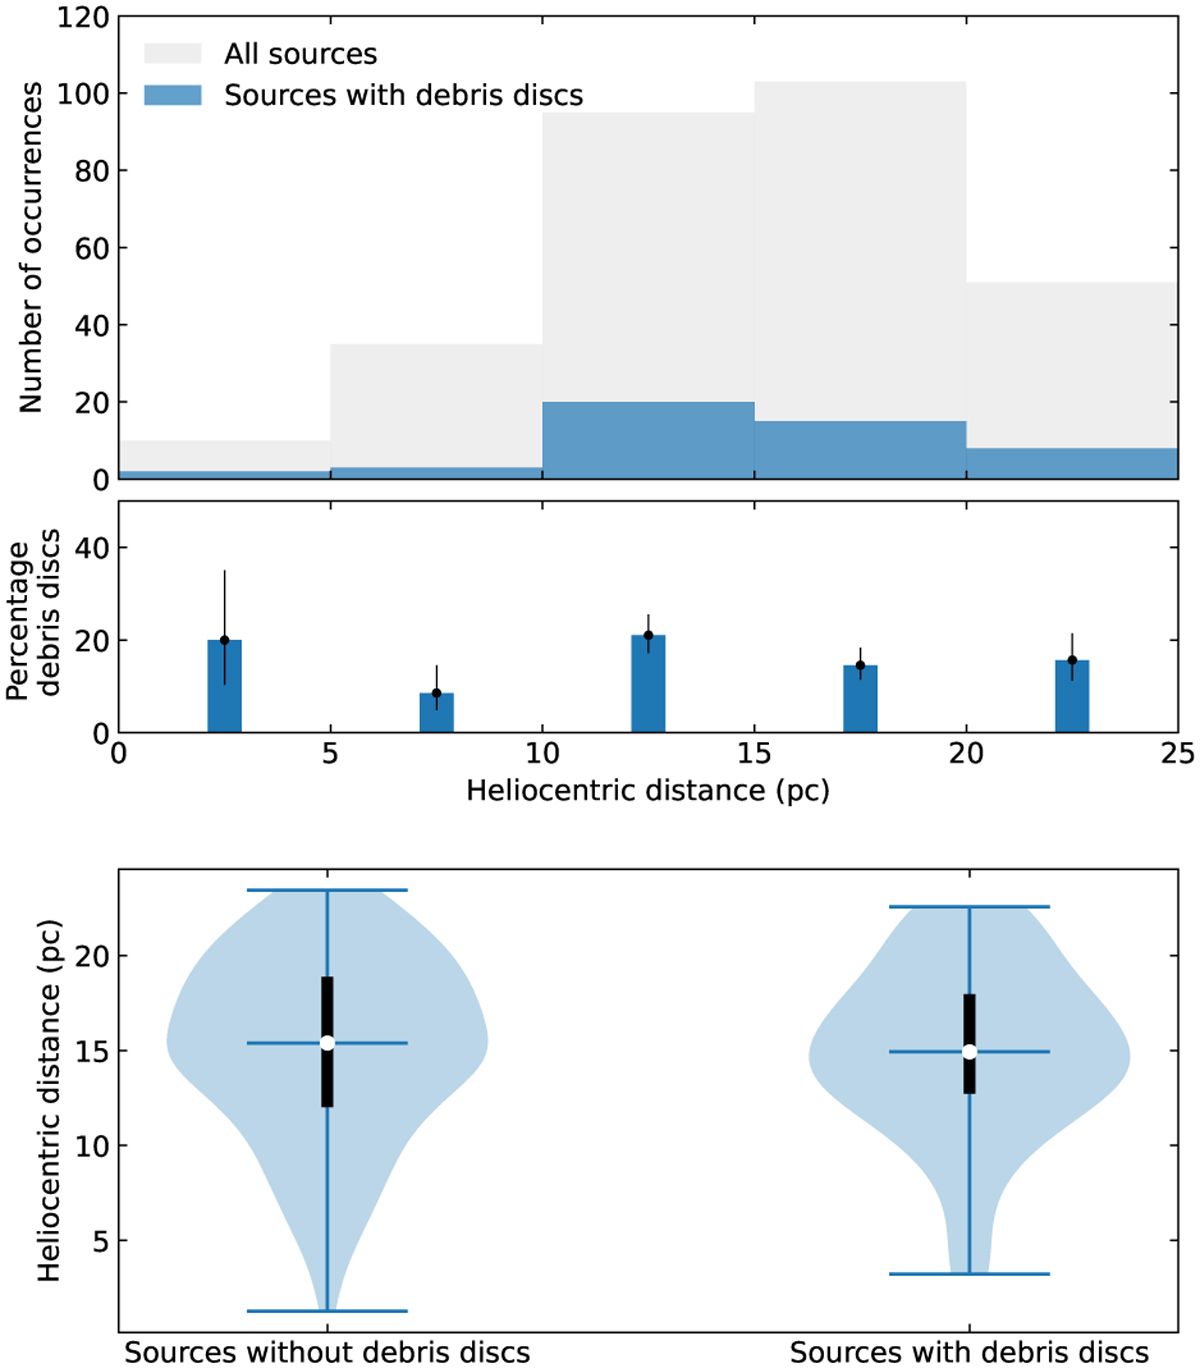
Occurrence rate of debris discs as a function of heliocentric distance. Top panel: histograms showing the total number of stars (grey bars) and stars with debris discs (blue bars) as a function of heliocentric distance. Middle panel: histogram showing the percentage of stars that have debris discs as a function of heliocentric distance. Bottom panel: probability distributions as a function of heliocentric distance (a more detailed explanation of the violin diagrams can be found in the caption of Fig. 2).
Current usage metrics show cumulative count of Article Views (full-text article views including HTML views, PDF and ePub downloads, according to the available data) and Abstracts Views on Vision4Press platform.
Data correspond to usage on the plateform after 2015. The current usage metrics is available 48-96 hours after online publication and is updated daily on week days.
Initial download of the metrics may take a while.