Fig. 2
Download original image
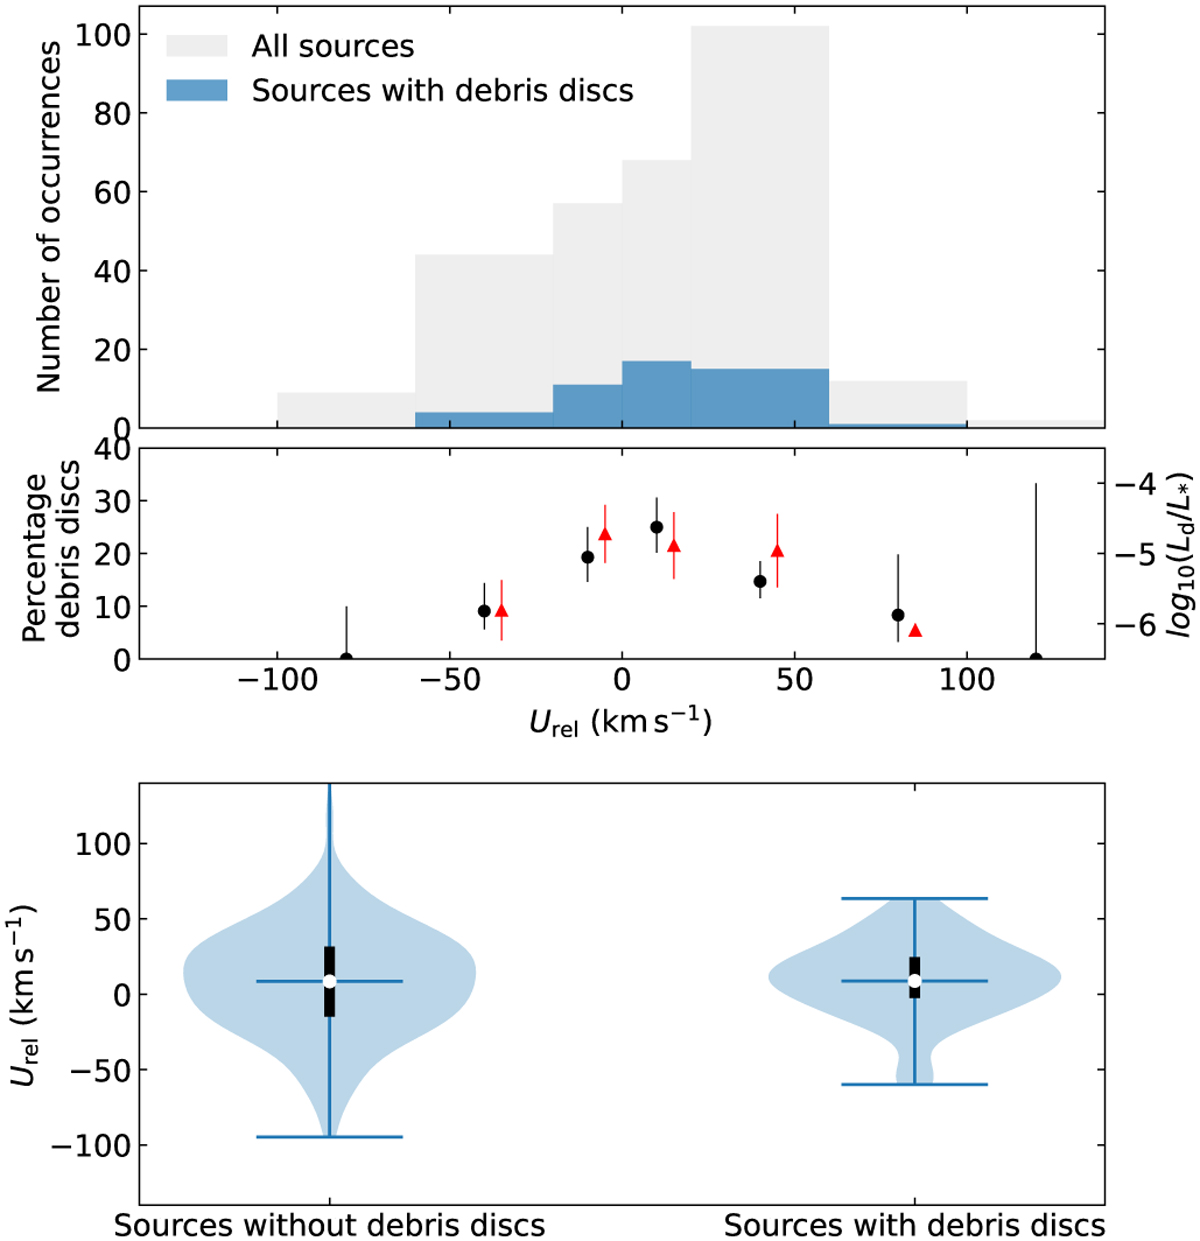
Occurrence rate of debris discs as a function of space velocity component Urel. Top panel: histograms showing the total number of stars (grey bars) and stars with debris discs (blue bars) as a function of Urel. Middle panel: percentage of stars that have debris discs (black dots) and the median of the logarithm of the disc fractional luminosity in each bin (red triangles) as a function of Urel. Bottom panel: violin diagrams representing the probability density distribution of targets with and without debris discs as a function of Urel. The white dots show the median values, and the thick black lines indicate the interval between the first and third quartiles. The horizontal width of each blue-shaded violin area corresponds to the relative frequency of the corresponding objects as a function of Urel. To enhance visibility, the upper limit at Urel = 303 km s−1 of the first violin is not included in the figure. We see that the probability density distribution as a function of Urel is narrower for stars with debris discs than for stars without debris discs.
Current usage metrics show cumulative count of Article Views (full-text article views including HTML views, PDF and ePub downloads, according to the available data) and Abstracts Views on Vision4Press platform.
Data correspond to usage on the plateform after 2015. The current usage metrics is available 48-96 hours after online publication and is updated daily on week days.
Initial download of the metrics may take a while.