Open Access
Fig. 10
Download original image
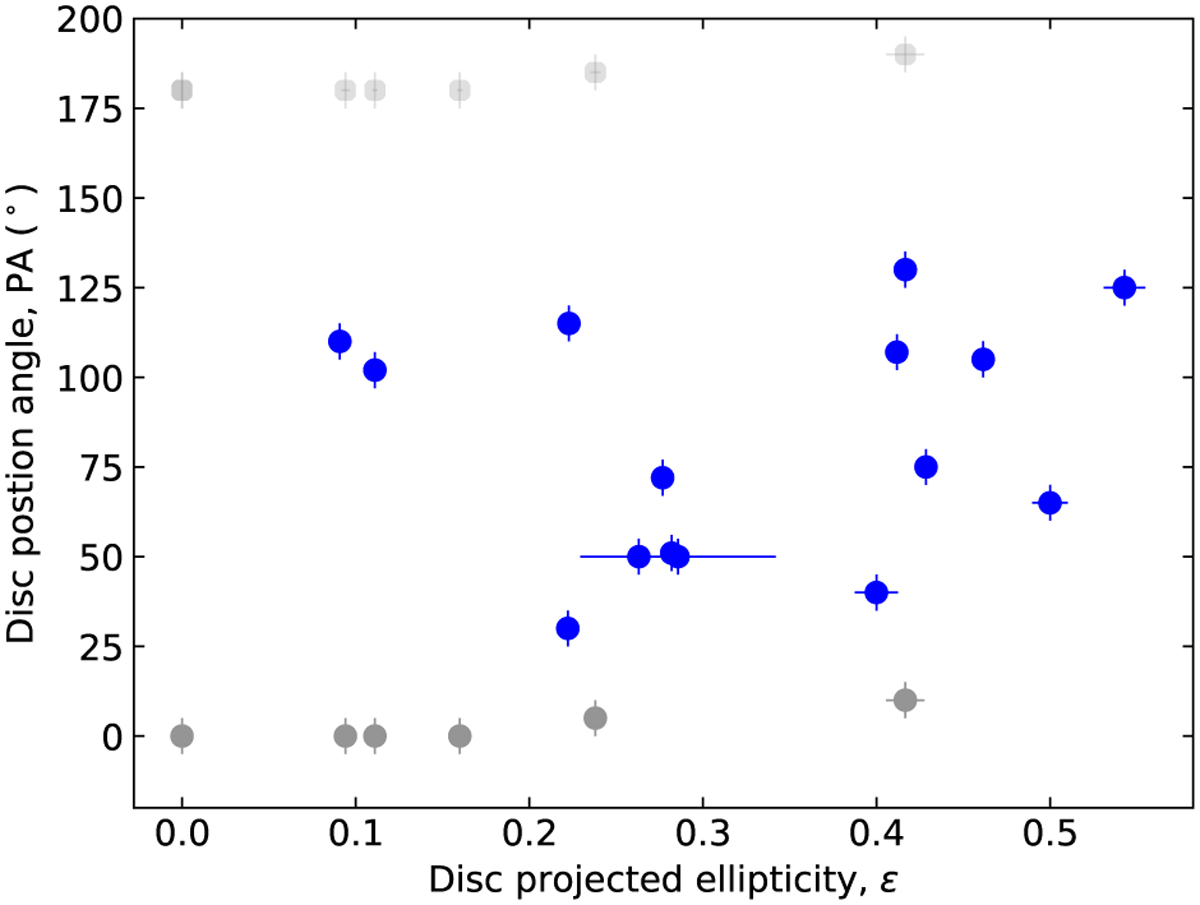
PAs of the debris discs as a function of the discs projected ellipticities, ϵ. Discs with PA ≤ 10° are represented with grey dots because, considering their uncertainty (±5°), their actual value could be about 180°. To illustrate the effect on the trend, the corresponding values around 180° are also shown in light grey.
Current usage metrics show cumulative count of Article Views (full-text article views including HTML views, PDF and ePub downloads, according to the available data) and Abstracts Views on Vision4Press platform.
Data correspond to usage on the plateform after 2015. The current usage metrics is available 48-96 hours after online publication and is updated daily on week days.
Initial download of the metrics may take a while.