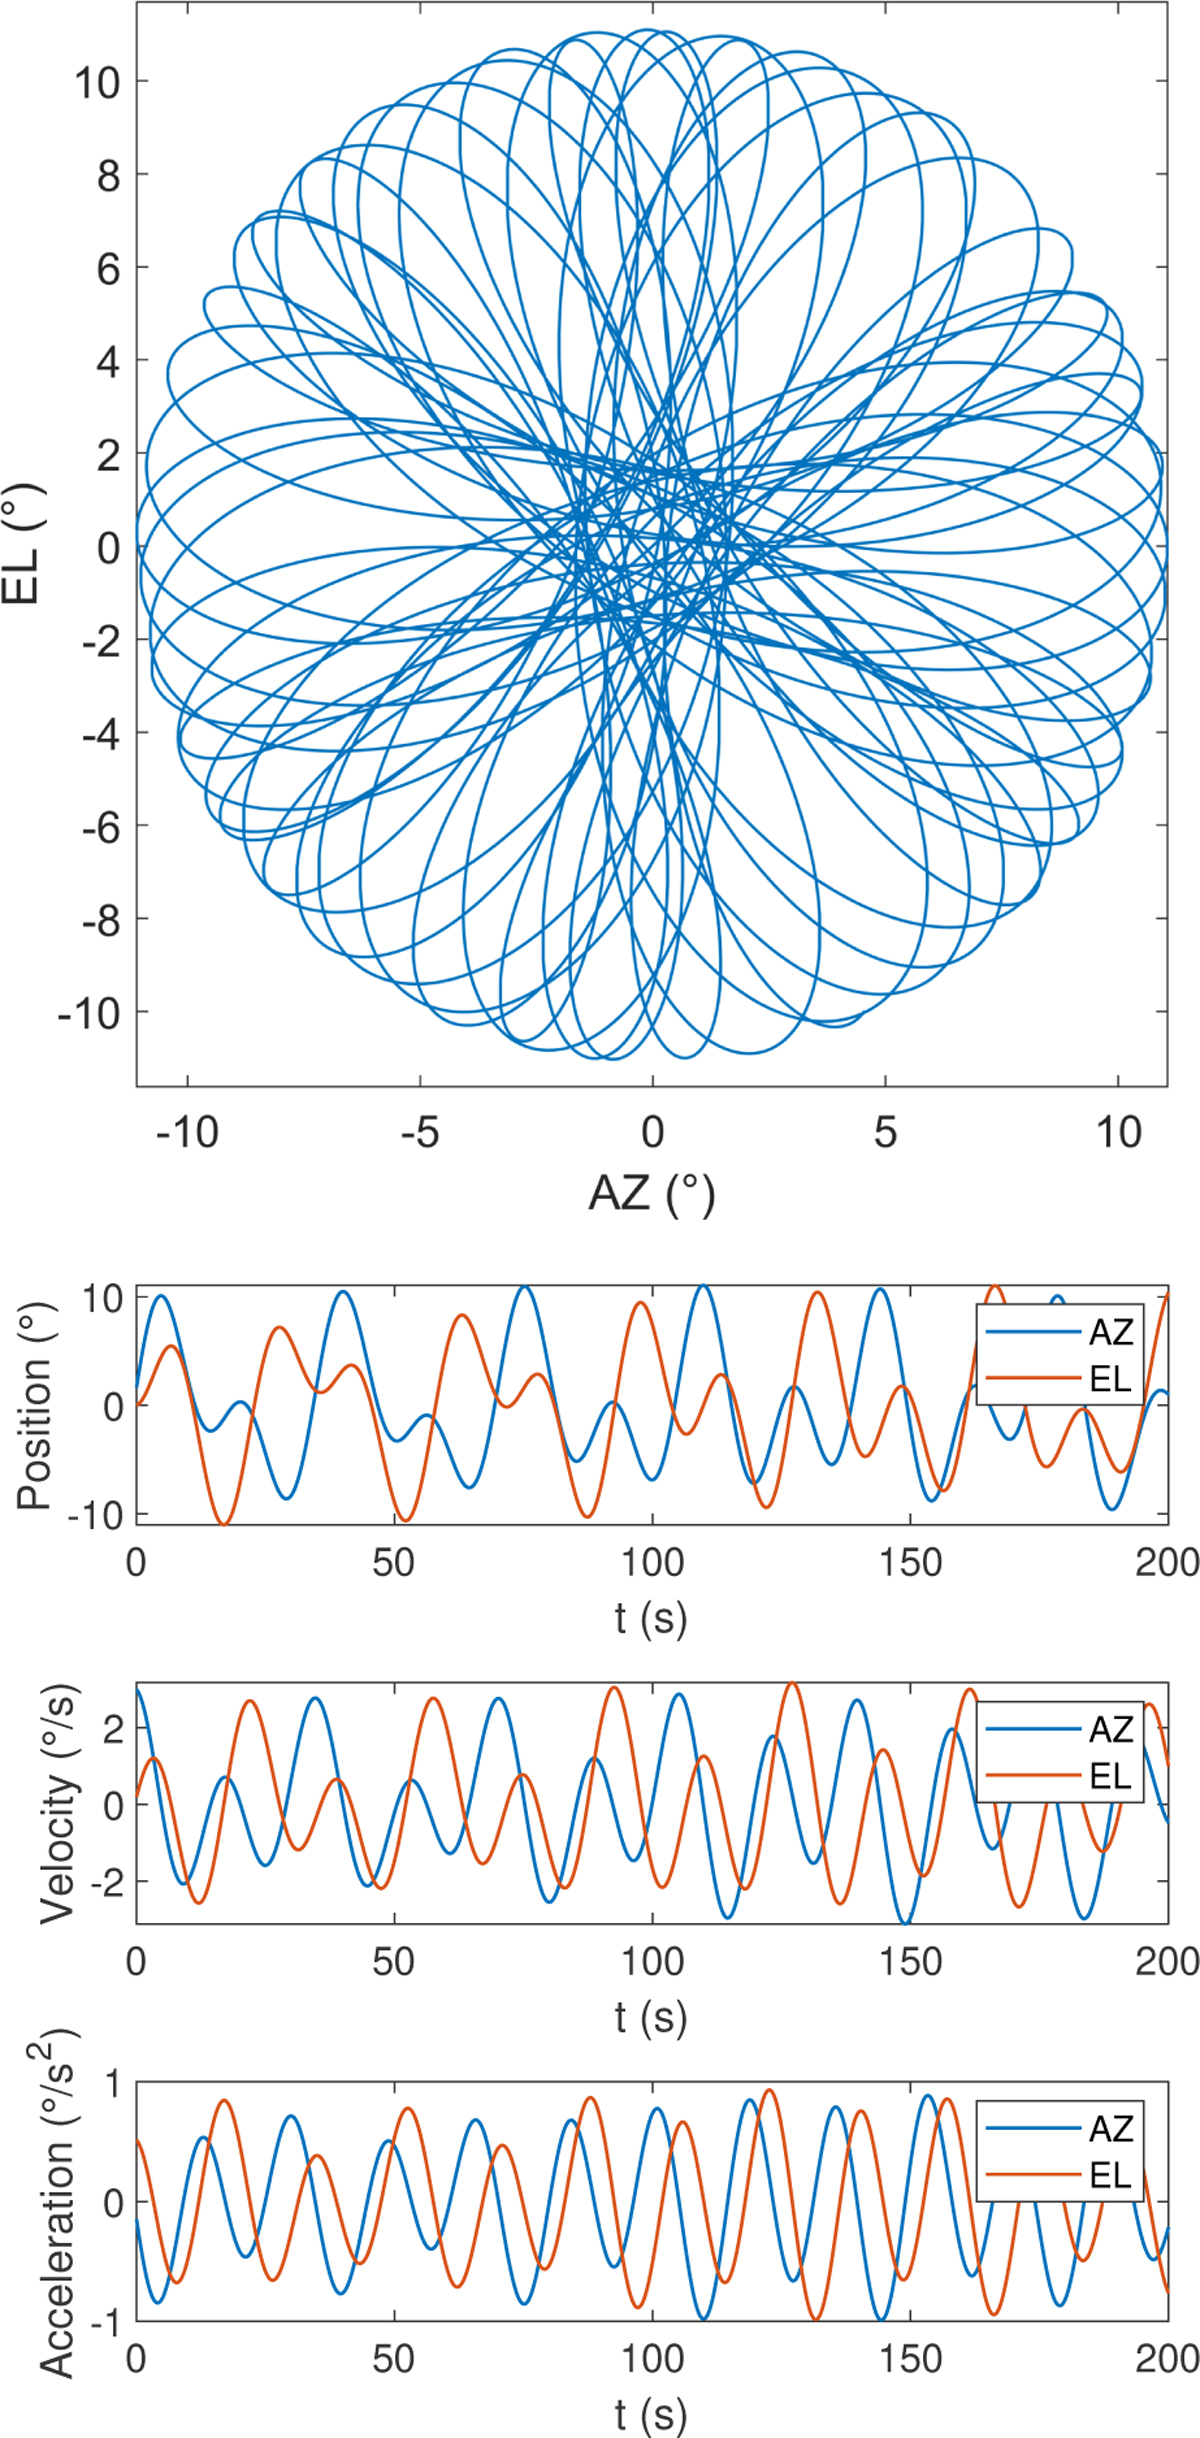
Fig. 2
Download original image
Representative Lissajous daisy scan for AtLAST that, at its maximum velocity and acceleration, reaches the kinematic constraint and antenna drive limits. The top panel shows the relative offsets in elevation and azimuth with respect to the field center, and the lower plots show the corresponding position, velocity, and acceleration as a function of time. Figure 12 shows the associated power demands of this example scanning pattern.
Current usage metrics show cumulative count of Article Views (full-text article views including HTML views, PDF and ePub downloads, according to the available data) and Abstracts Views on Vision4Press platform.
Data correspond to usage on the plateform after 2015. The current usage metrics is available 48-96 hours after online publication and is updated daily on week days.
Initial download of the metrics may take a while.