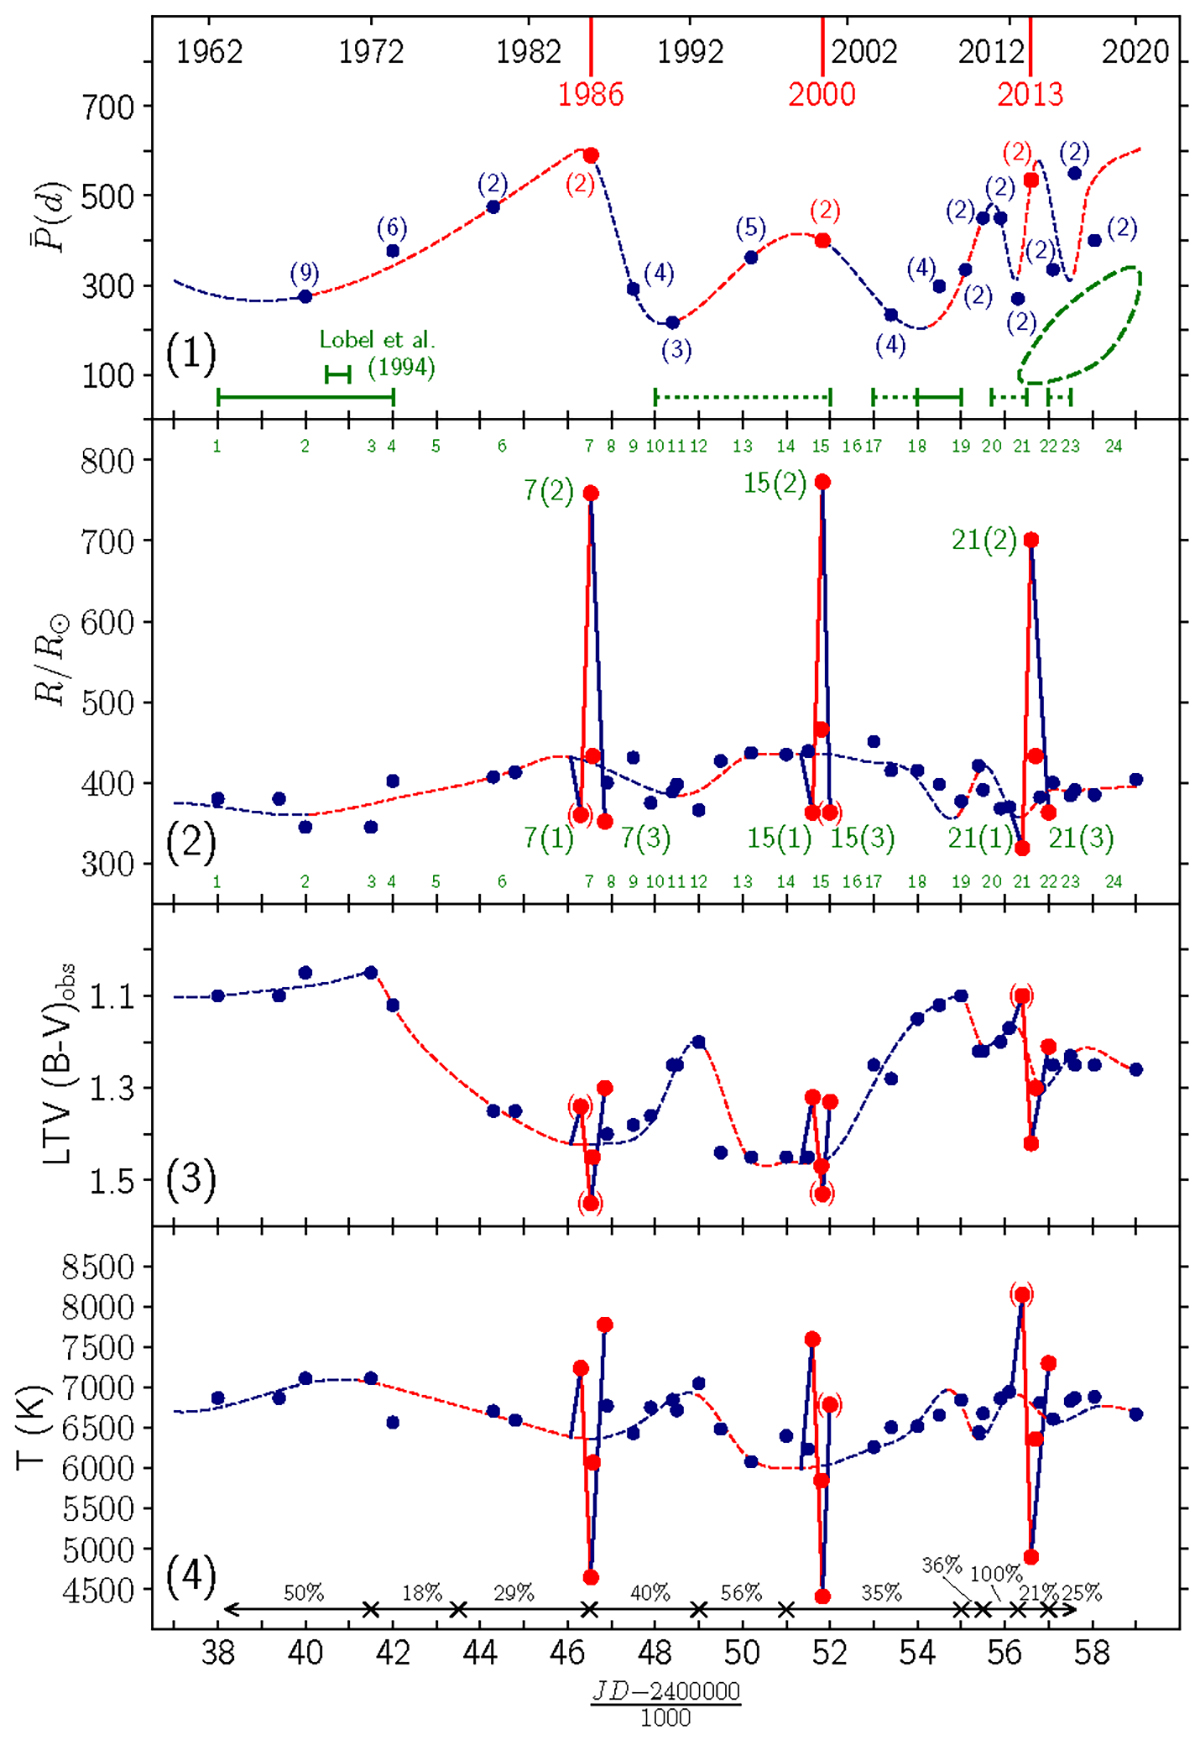
Fig. 7.
Download original image
Diagram showing the data points of the four median curves in 1962–2020 of ρ Cas, as well as the four characteristic points of the outbursts. The time-scale is reduced JDs. The time-scale of the wave pattern in the four panels is ∼15 y. From bottom to top the panels show Teff, (B − V)obs, stellar radius R/R⊙, and the average quasi-periods P(d) (number of pulsations used are marked with brackets). Ordinary data points are dark-blue while the four characteristic points of the outbursts are red. The latter are plotted in panels 1–3 representing max1, the median between the descending and ascending branch, min1, and max2 (see Sect. 8.2).
Current usage metrics show cumulative count of Article Views (full-text article views including HTML views, PDF and ePub downloads, according to the available data) and Abstracts Views on Vision4Press platform.
Data correspond to usage on the plateform after 2015. The current usage metrics is available 48-96 hours after online publication and is updated daily on week days.
Initial download of the metrics may take a while.