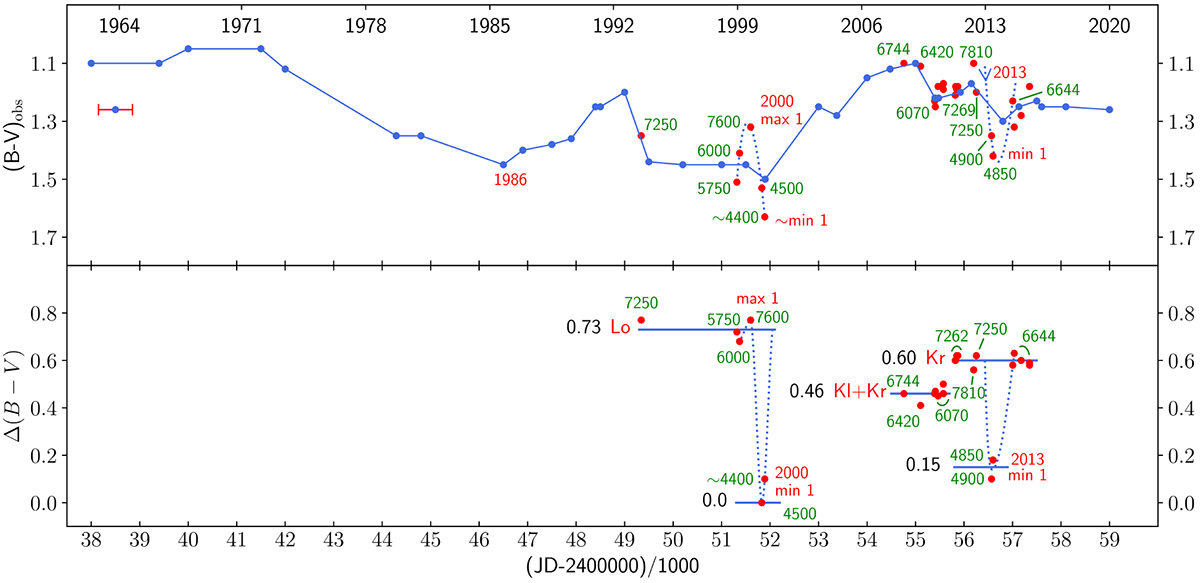
Fig. 1.
Download original image
LTV of ρ Cas between 1962 and 2020. Top panel: Median (B − V)obs versus the reduced JD. The dark blue dots define the dark-blue unsteady median. Red dots represent the photometric observations with an available Teff value (green numbers). Bottom panel: δ (B − V) = (B − V)0 – (B − V)dJN versus the reduced JD. Red dots and green numbers are similar to those in the top panel (see discussion in Sect. 2.2).
Current usage metrics show cumulative count of Article Views (full-text article views including HTML views, PDF and ePub downloads, according to the available data) and Abstracts Views on Vision4Press platform.
Data correspond to usage on the plateform after 2015. The current usage metrics is available 48-96 hours after online publication and is updated daily on week days.
Initial download of the metrics may take a while.