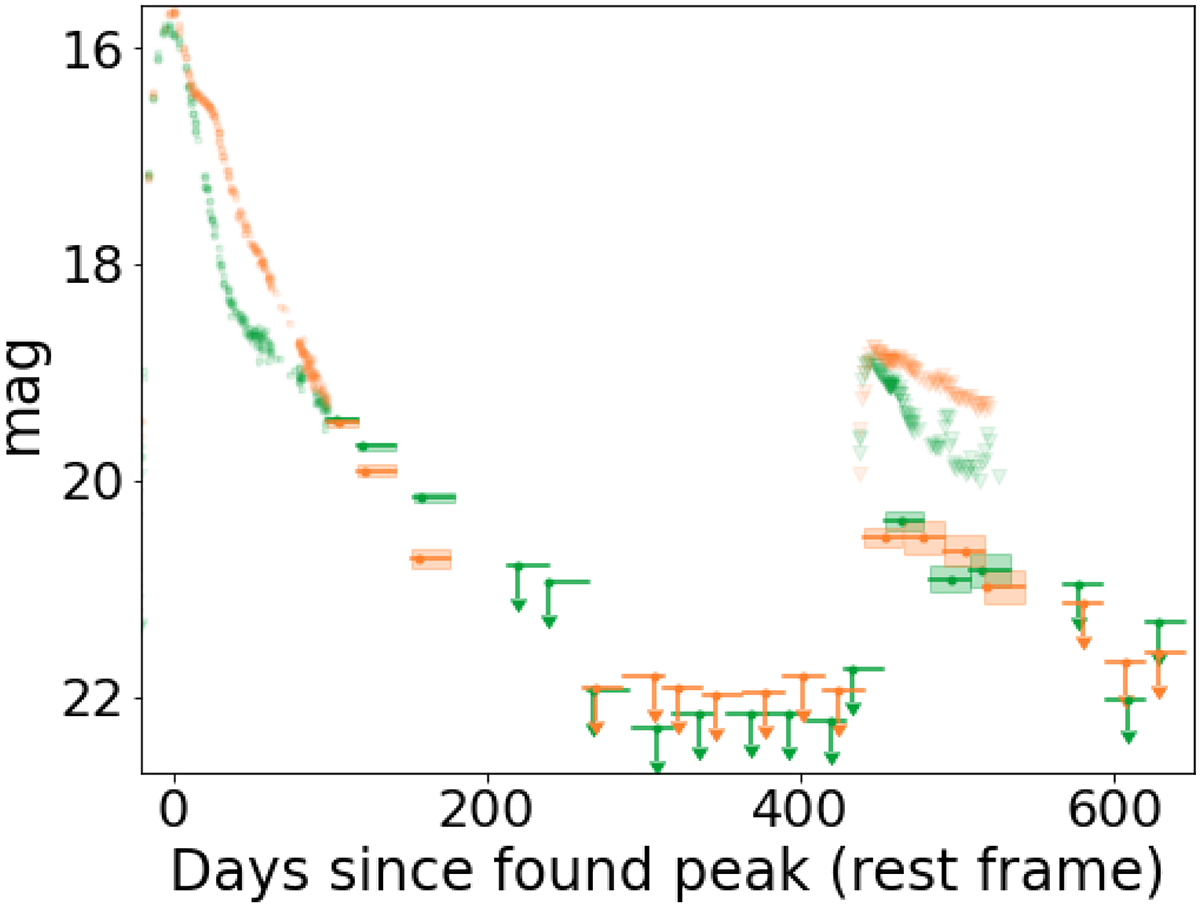
Fig. 7.
Download original image
Light curves of SN 2018big and its sibling SN 2019nvm in magnitude space using bins of 25 d. The g (green) and r (orange) bins follow the tail of SN 2018big until it disappears in the noise. About 450 d after the peak of SN 2018big, new detections are identified in the binned photometry. The individual observations remain upper limits, although their shape hint to the true nature of these late-time detections.
Current usage metrics show cumulative count of Article Views (full-text article views including HTML views, PDF and ePub downloads, according to the available data) and Abstracts Views on Vision4Press platform.
Data correspond to usage on the plateform after 2015. The current usage metrics is available 48-96 hours after online publication and is updated daily on week days.
Initial download of the metrics may take a while.