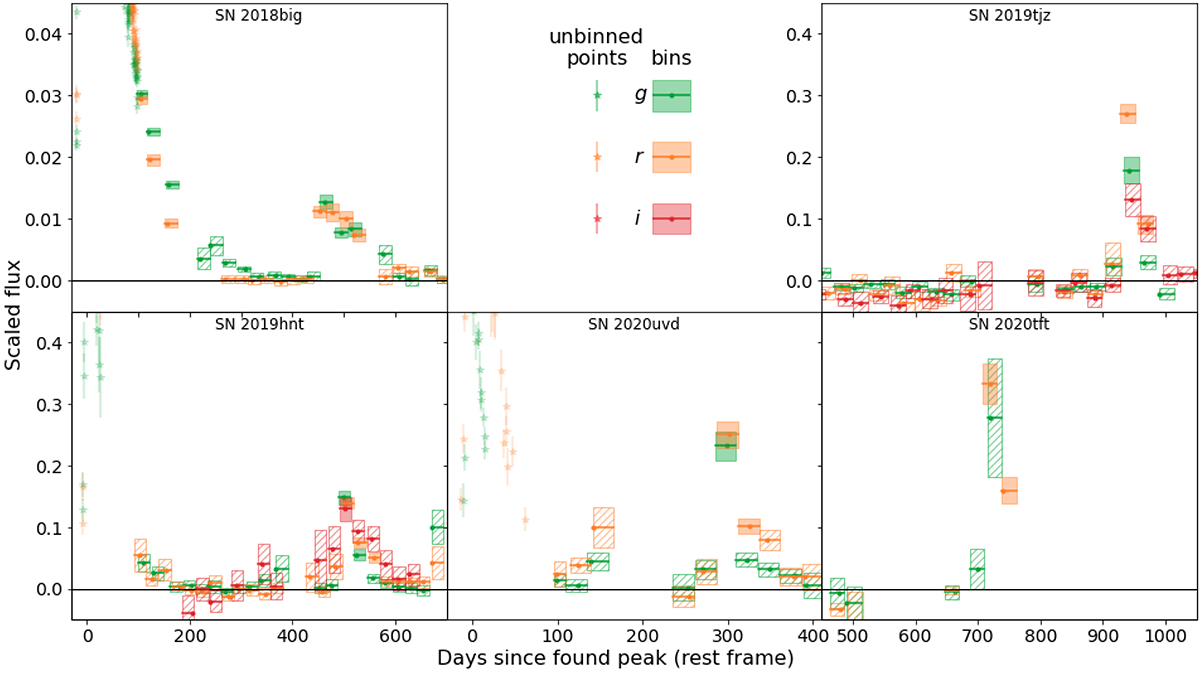
Fig. 6.
Download original image
Binned late-time observations in flux space of the five events with a detected sibling, with the flux normalised to the found peak flux. All objects are plotted on the same flux scale for easy comparison except for SN 2018big, as its late-time detections are much weaker compared to the original SN peak magnitude due to the larger distance offset between the siblings.
Current usage metrics show cumulative count of Article Views (full-text article views including HTML views, PDF and ePub downloads, according to the available data) and Abstracts Views on Vision4Press platform.
Data correspond to usage on the plateform after 2015. The current usage metrics is available 48-96 hours after online publication and is updated daily on week days.
Initial download of the metrics may take a while.