Fig. 4.
Download original image
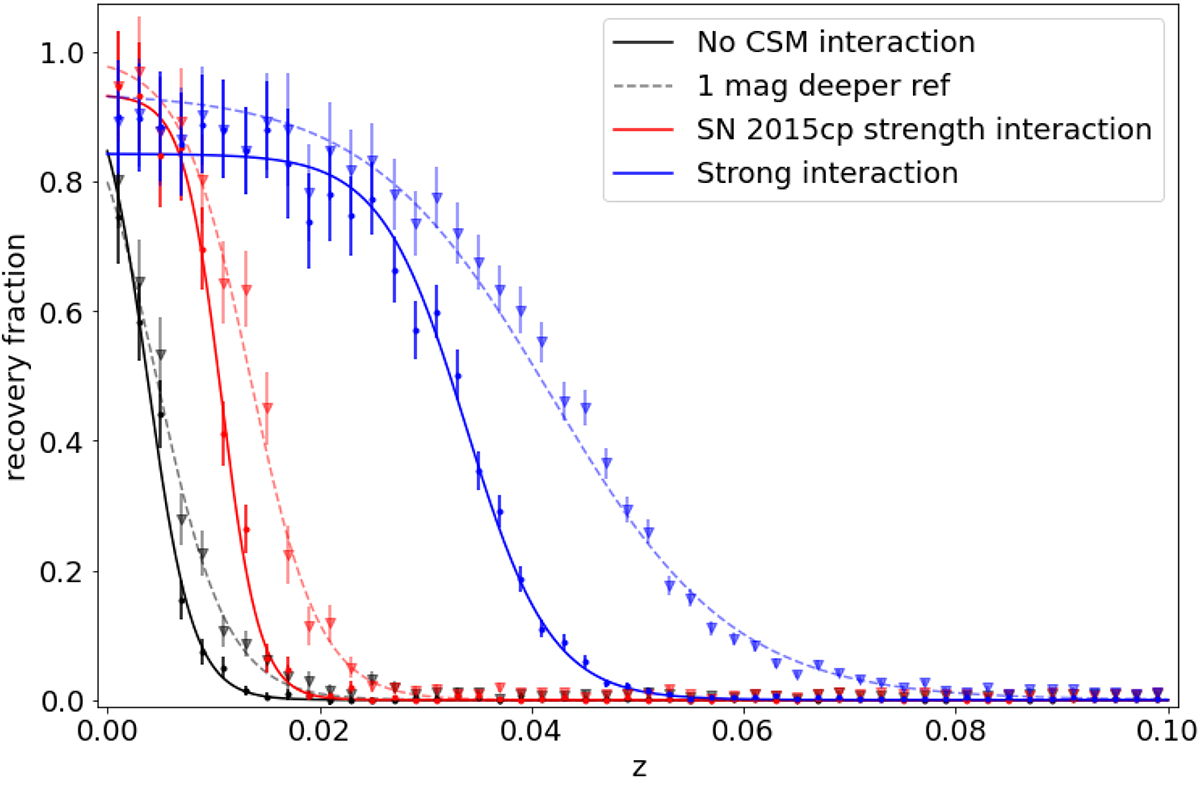
Fraction of SNe Ia for one of our simulations (interaction occurring between 500 and 1000 d after the peak) where the CSM interaction was recovered per redshift bin of size 0.002. The simulations are shown for interaction strengths of zero (grey), similar to SN 2015cp (red), and 10 times stronger than SN 2015cp (blue). In the simulation without CSM interaction, the recovery fraction should be interpreted as the fraction of false positives. The simulations with normal ZTF quality reference images are shown with dots and fitted sigmoid functions with solid lines. Simulations where one magnitude deeper reference images were assumed are shown in triangles, with their fitted sigmoid functions in dashed lines.
Current usage metrics show cumulative count of Article Views (full-text article views including HTML views, PDF and ePub downloads, according to the available data) and Abstracts Views on Vision4Press platform.
Data correspond to usage on the plateform after 2015. The current usage metrics is available 48-96 hours after online publication and is updated daily on week days.
Initial download of the metrics may take a while.