Fig. 3.
Download original image
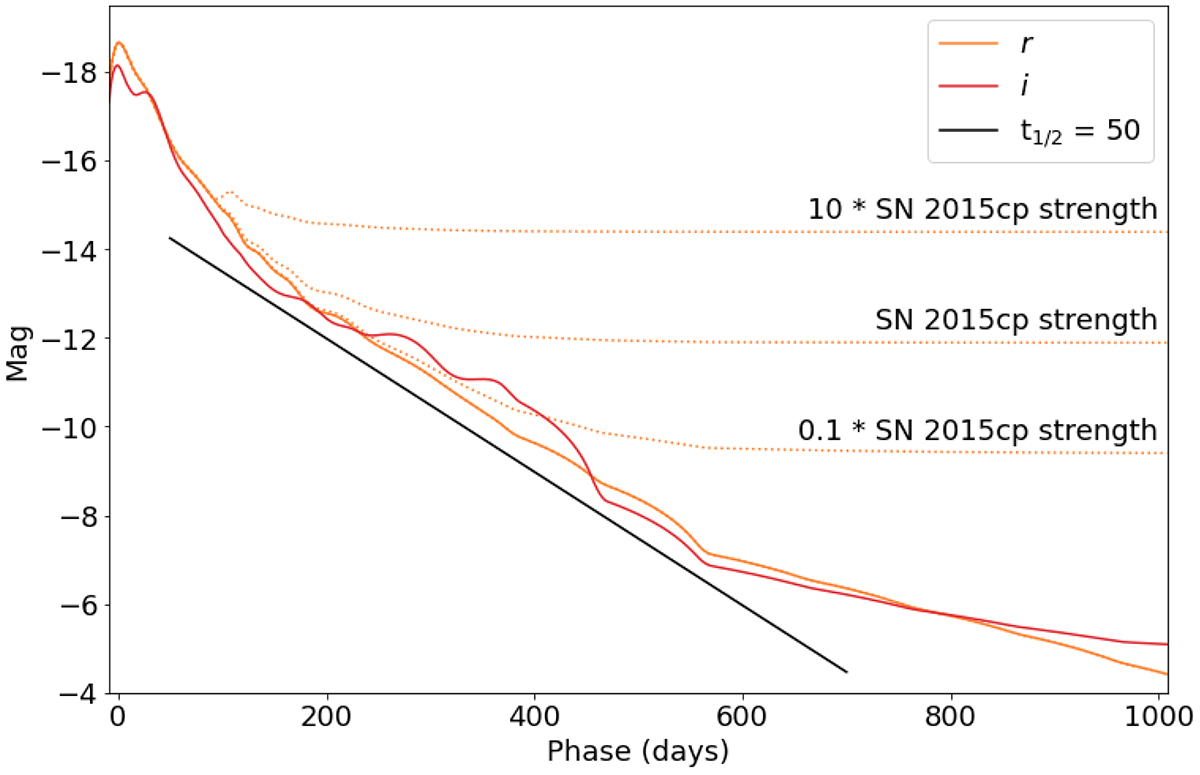
r (orange) and i (red) absolute magnitude light curves of the SN 2011fe model used in the simulations in the ZTF bands as a function of phase from rest-frame B-band peak (Mazzali et al. 2014). The bumpiness in the models is because the underlying SNCOSMO model class interpolates in flux space but fails to find an exponential decay. The added rest-frame CSM interaction model based on Hα emission (starting at a phase of 100 d) is shown with dotted lines for the r-band. Once the interaction becomes the dominant source, it smooths out the bumps from the underlying tail. The black line shows a radioactive decay with t1/2 = 50 d, typical of a declining normal SN Ia tail.
Current usage metrics show cumulative count of Article Views (full-text article views including HTML views, PDF and ePub downloads, according to the available data) and Abstracts Views on Vision4Press platform.
Data correspond to usage on the plateform after 2015. The current usage metrics is available 48-96 hours after online publication and is updated daily on week days.
Initial download of the metrics may take a while.