Fig. 2.
Download original image
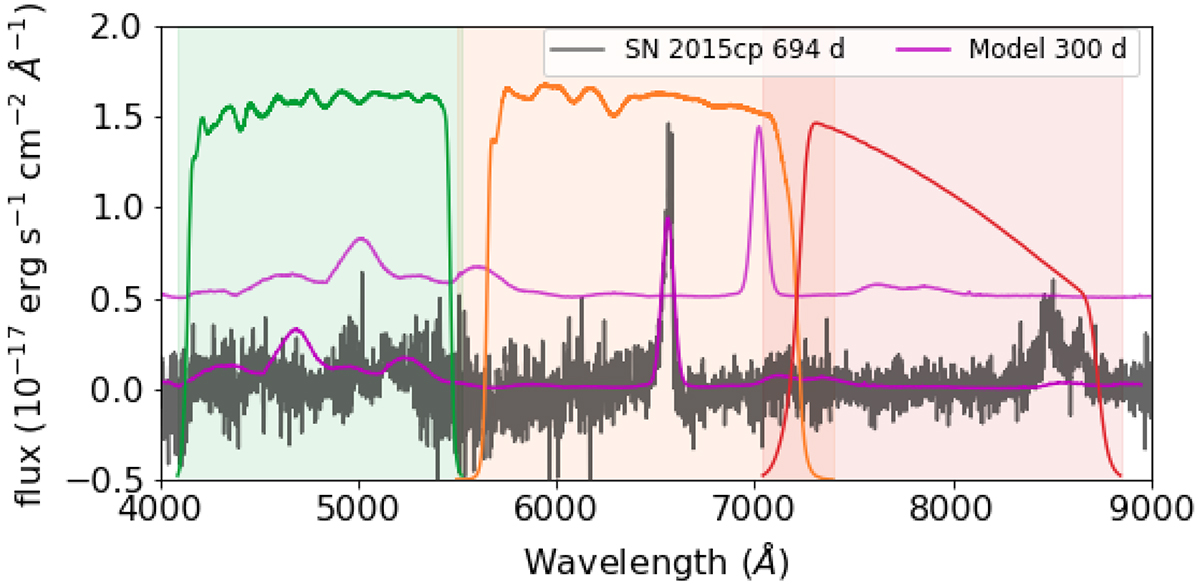
Model spectrum at 300 days (SN 2011fe with the added Hα line) is shown in magenta overlaid on a rest-frame spectrum of SN 2015cp at 694 days in grey. The model flux has been scaled to the distance of SN 2015cp for comparison. The green, orange, and red shaded regions are the bandwidths of the g-, r-, and i-bands, respectively. The transmission profiles are plotted in the same colours for each band. The model is also shown shifted to z = 0.07 (and offset up in flux), where the Hα line has just started to be in the i-band.
Current usage metrics show cumulative count of Article Views (full-text article views including HTML views, PDF and ePub downloads, according to the available data) and Abstracts Views on Vision4Press platform.
Data correspond to usage on the plateform after 2015. The current usage metrics is available 48-96 hours after online publication and is updated daily on week days.
Initial download of the metrics may take a while.