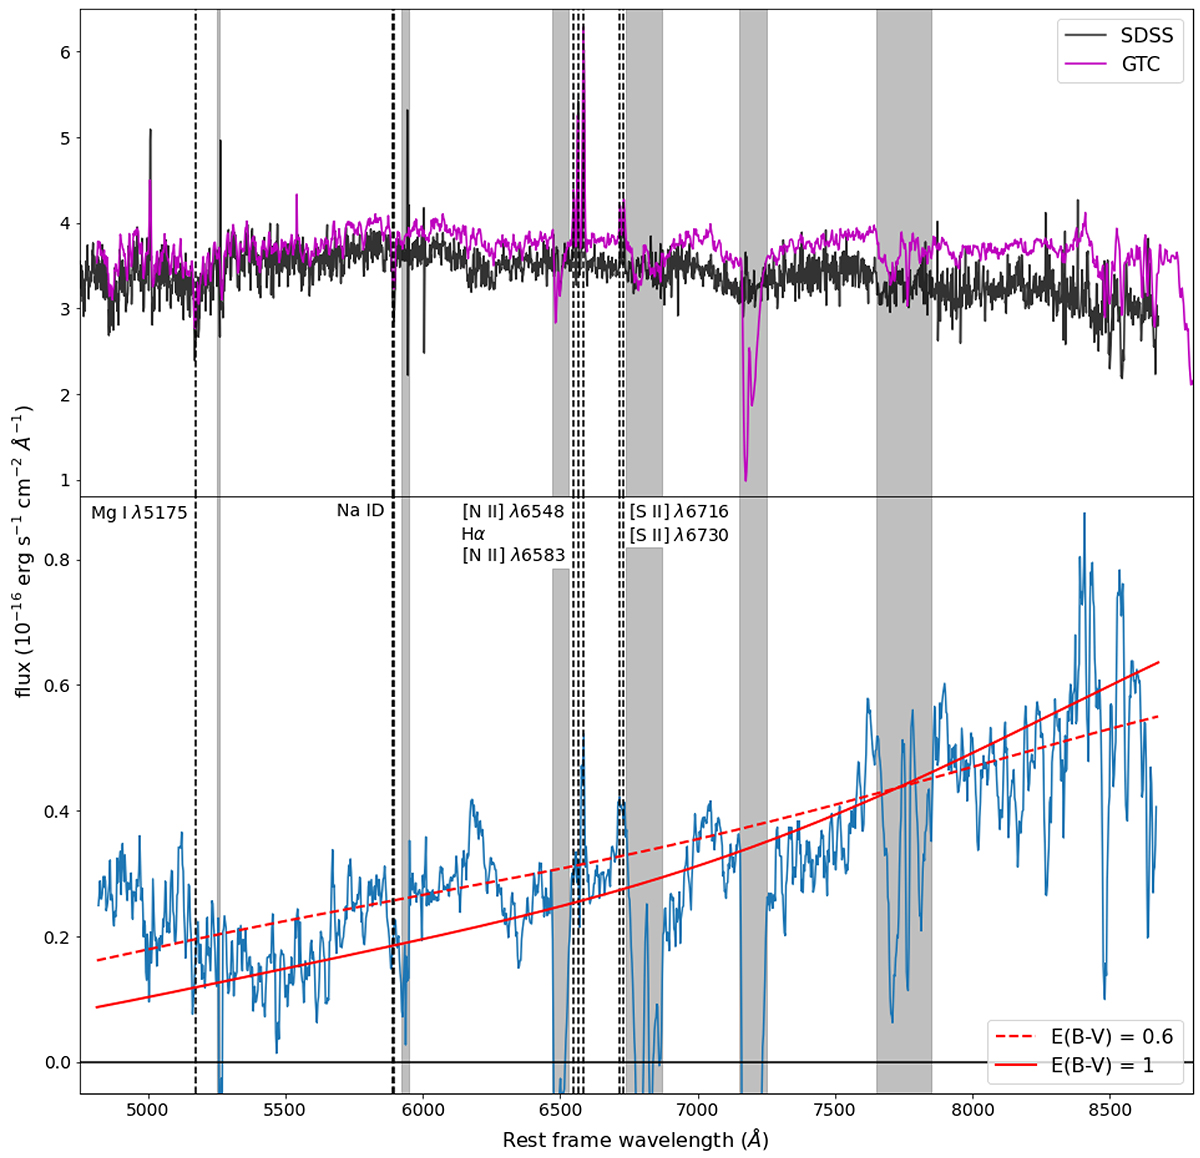
Fig. C.1.

Download original image
Spectrum of the late-time signal in SN 2020alm in its rest frame. The top panel shows the late-time spectrum obtained on 26 July 2023 using OSIRIS on the GTC, and the SDSS spectrum obtained in 2003. The bottom panel shows the late-time excess, obtained by subtracting the SDSS host galaxy spectrum from the observed late-time spectrum. A smoothed spectrum is shown in blue. The smoothing was done using a rolling kernel of size 5 to average over the values. The red lines are a simple TDE model with Milky Way and some amount of host galaxy extinction applied (the amount is shown in the legend), in order to get the approximate shape of the observed spectrum. Narrow emission and absorption lines that were notable in the unsubtracted spectrum are marked with dashed lines. The grey regions are affected by sky lines, and should be ignored. The late-time spectrum of SN 2020alm is available in electronic form at the CDS or upon request to the author.
Current usage metrics show cumulative count of Article Views (full-text article views including HTML views, PDF and ePub downloads, according to the available data) and Abstracts Views on Vision4Press platform.
Data correspond to usage on the plateform after 2015. The current usage metrics is available 48-96 hours after online publication and is updated daily on week days.
Initial download of the metrics may take a while.


