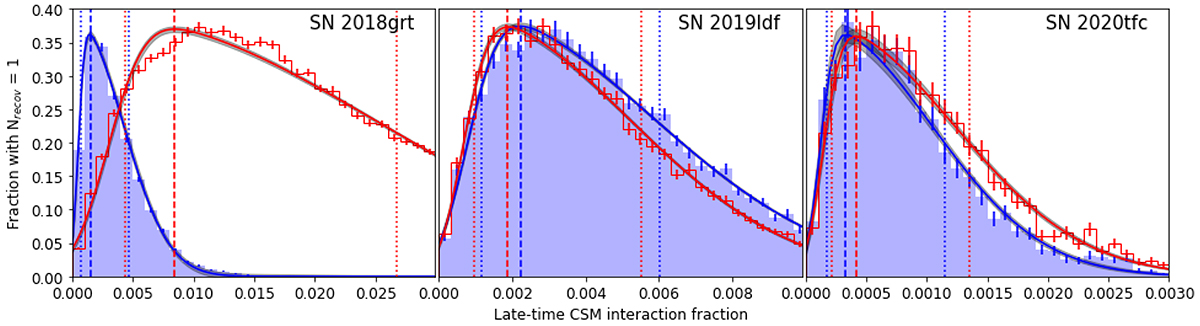
Fig. 13.
Download original image
Fraction of MCMC realisations per bin that resulted in one object being recovered in a sample with the same size as the effective DR2 sample size as a function of the late-time CSM interaction fraction. The best and worst case scenario for each object is shown in blue and red, respectively. A skewed normal distribution fit with a 1σ uncertainty band is shown for each scenario, and the dashed and dotted lines give maximum and 68% confidence interval of these distributions, respectively. The distributions continue on the right side of each plot.
Current usage metrics show cumulative count of Article Views (full-text article views including HTML views, PDF and ePub downloads, according to the available data) and Abstracts Views on Vision4Press platform.
Data correspond to usage on the plateform after 2015. The current usage metrics is available 48-96 hours after online publication and is updated daily on week days.
Initial download of the metrics may take a while.