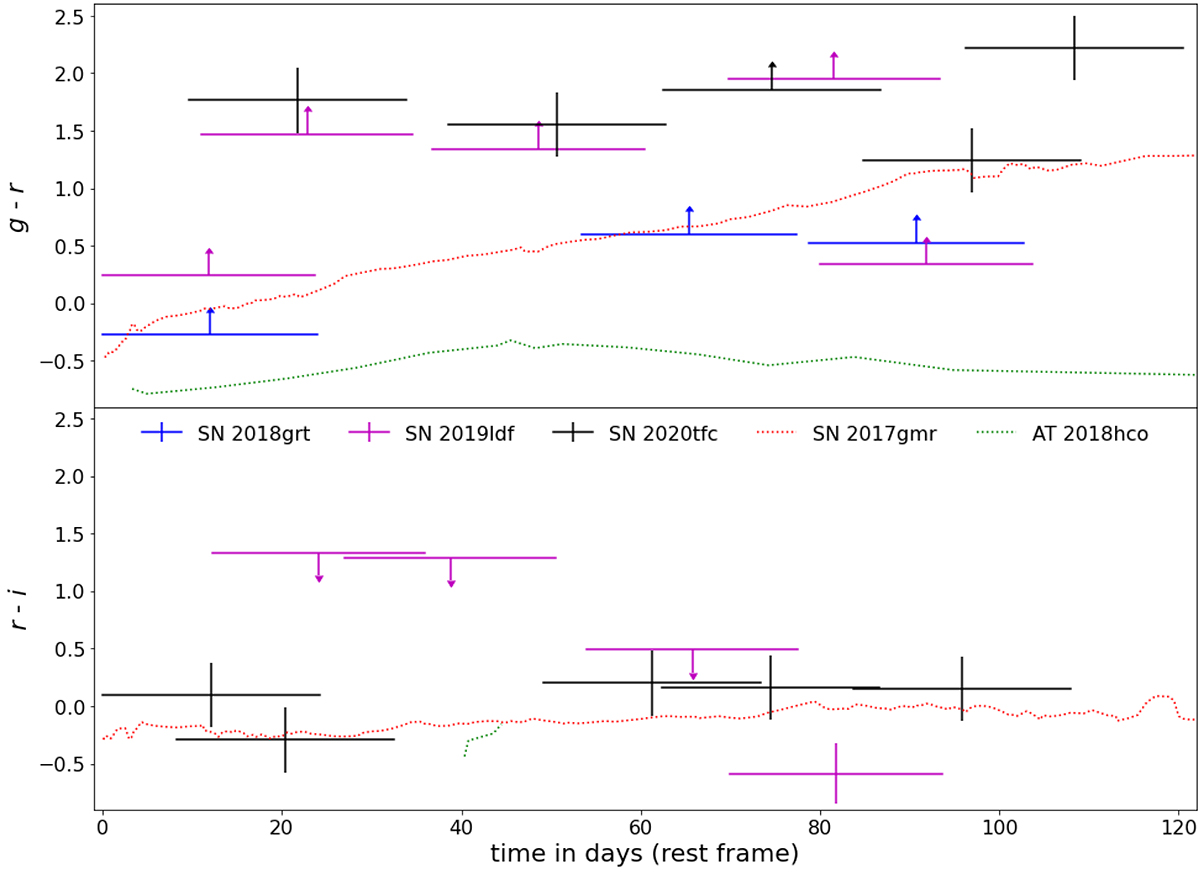
Fig. 12.
Download original image
Colour curves of the three candidate objects, together with the colours of the best fitting alternate transients. The top and bottom panels show g–r and r–i, respectively. The first bin for each object starts at zero days, but the bins can be shifted horizontally in an attempt to better fit the colour curve of the transient compared against (given that this is allowed by the rest of the light curve). Bins whose mean observation dates are closest to each other are used to calculate the colour, provided that these bins overlap in time. If there is a detection in only one band used to calculate the colour while the other is a non-detection, the result is a lower or upper limit.
Current usage metrics show cumulative count of Article Views (full-text article views including HTML views, PDF and ePub downloads, according to the available data) and Abstracts Views on Vision4Press platform.
Data correspond to usage on the plateform after 2015. The current usage metrics is available 48-96 hours after online publication and is updated daily on week days.
Initial download of the metrics may take a while.