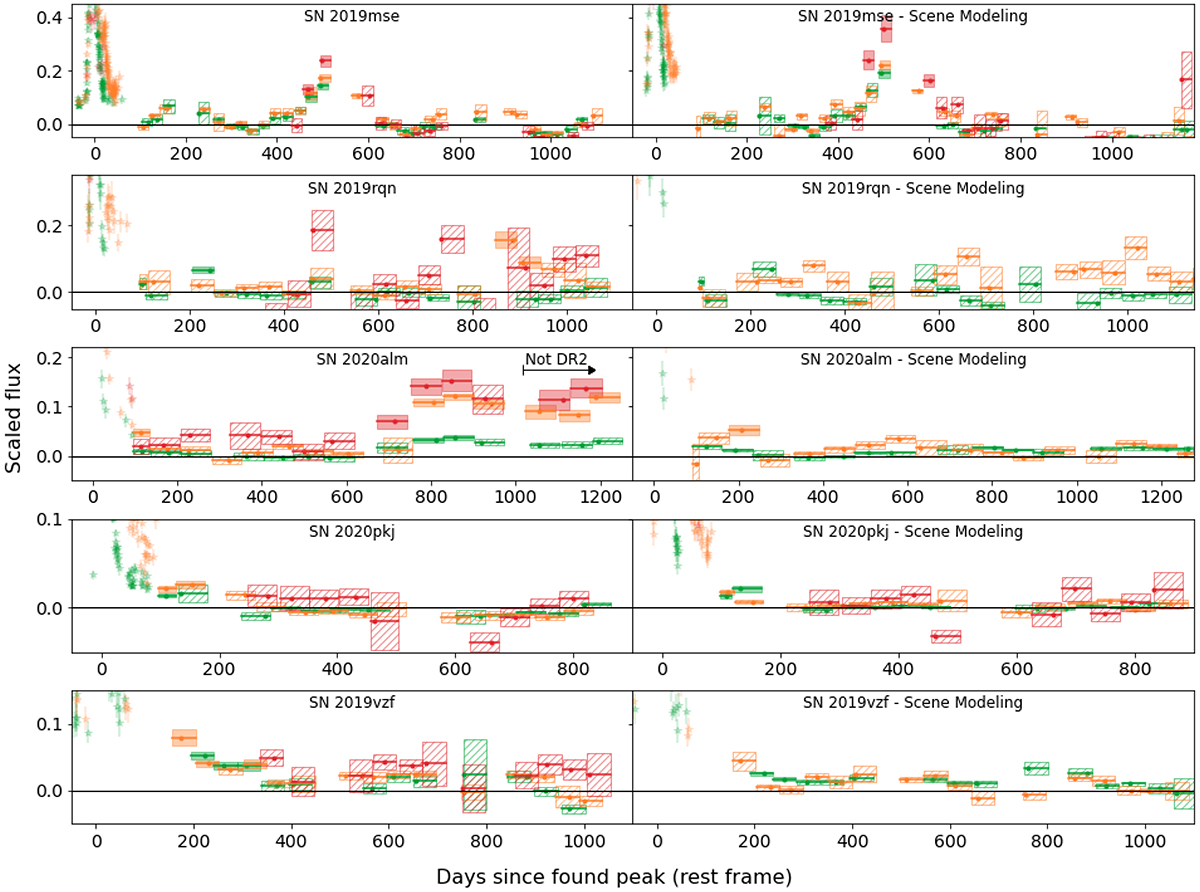
Fig. 10.
Download original image
Objects whose late-time detections are explained in the additional tests. The top four rows show the light curves of the objects where a previously undetected sibling transient as an explanation for the late-time observations could not be ruled out, with forced photometry light curves in the left-hand panels and the scene modelling photometry light curves in the right-hand panels. The 5σ detections are shown as bins with solid uncertainty regions and bins with hashed uncertainty regions are non-detections. The object whose late-time detections are caused by the host galaxy AGN, SN 2019vzf, is shown in the bottom row. The colours are as in Fig. 8 with g band in green, r band in orange, and i band in red.
Current usage metrics show cumulative count of Article Views (full-text article views including HTML views, PDF and ePub downloads, according to the available data) and Abstracts Views on Vision4Press platform.
Data correspond to usage on the plateform after 2015. The current usage metrics is available 48-96 hours after online publication and is updated daily on week days.
Initial download of the metrics may take a while.