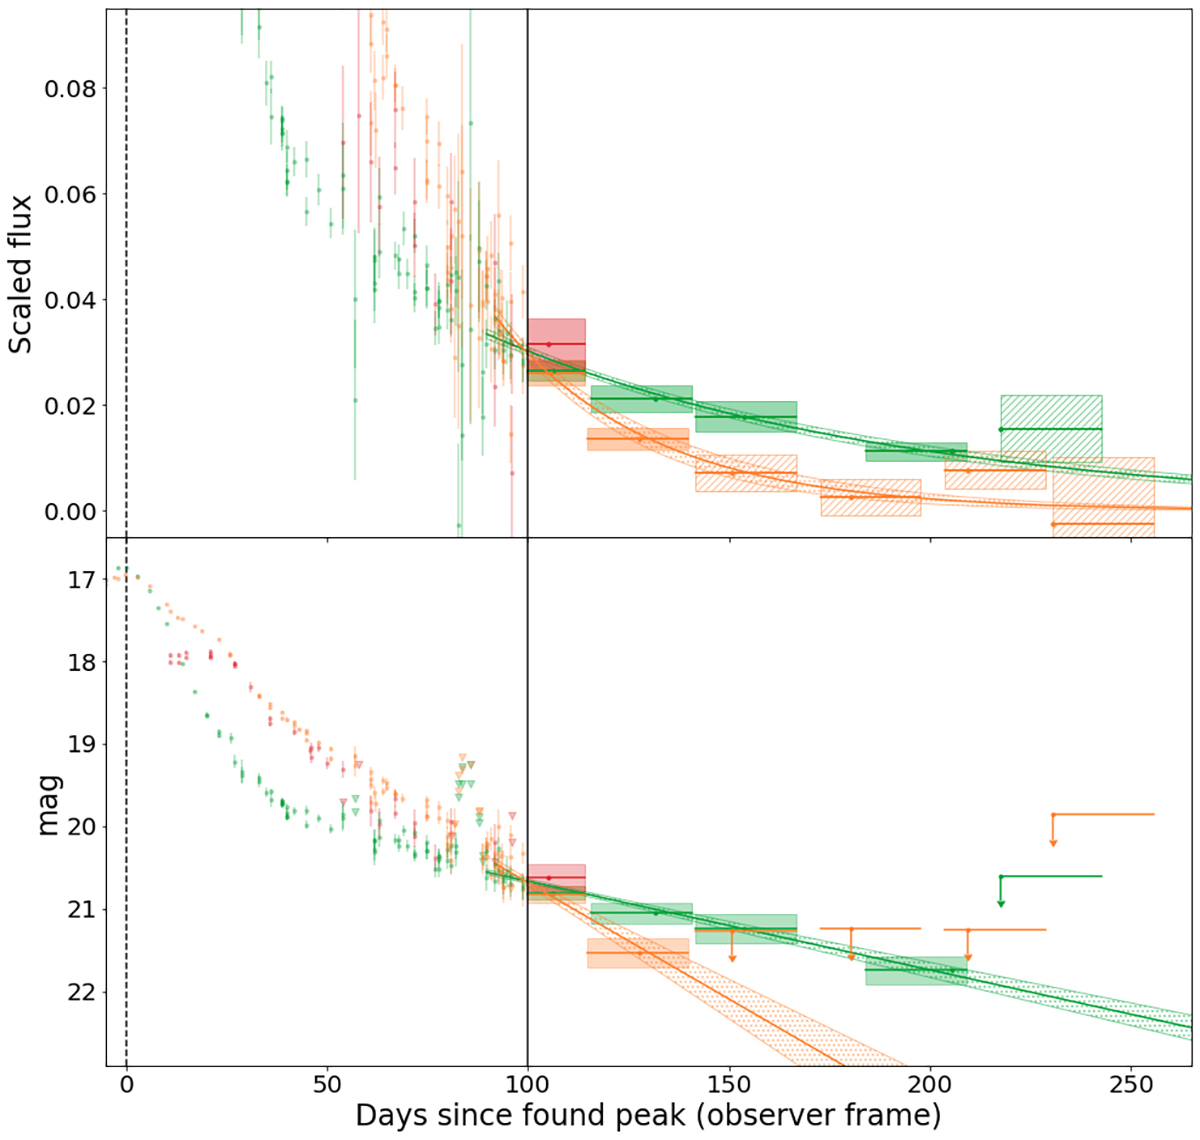
Fig. 1.
Download original image
First 250 days of the gri-band light curves of SN 2019hbb in flux scaled to the peak flux (top panel) and magnitude (bottom panel) space. Binning starts 100 days after the estimated peak date (vertical black dashed and solid lines), using 25 d bins. The g-, r-, and i-bands are shown green, orange, and red, respectively. Before 100 days, we show the unbinned detections with their uncertainties (coloured circles) and non-detections (inverted triangles). After 100 days we show the bins as horizontal lines to show their size, a circle to show their mean value, and the shaded region showing the 1σ uncertainty (dashed regions are non-detections). A bin is deemed a non-detection if the flux f < 5σf. The 5σ magnitude limit is calculated and shown as a downward arrow. In both the g- and r-bands, the first bin is a detection and there are multiple adjacent bins with detections, triggering the tail-fitting procedure (see Sect. 3.2). The resulting tail fits are shown in the green and red lines, respectively, with their 1σ uncertainties as hashed regions. The half-life times are t1/2, g = 70 ± 6 d (χred2 = 0.6) and t1/2, r = 27 ± 4 d (χred2 = 1.4). This tail is therefore deemed to be a normal SN Ia tail.
Current usage metrics show cumulative count of Article Views (full-text article views including HTML views, PDF and ePub downloads, according to the available data) and Abstracts Views on Vision4Press platform.
Data correspond to usage on the plateform after 2015. The current usage metrics is available 48-96 hours after online publication and is updated daily on week days.
Initial download of the metrics may take a while.