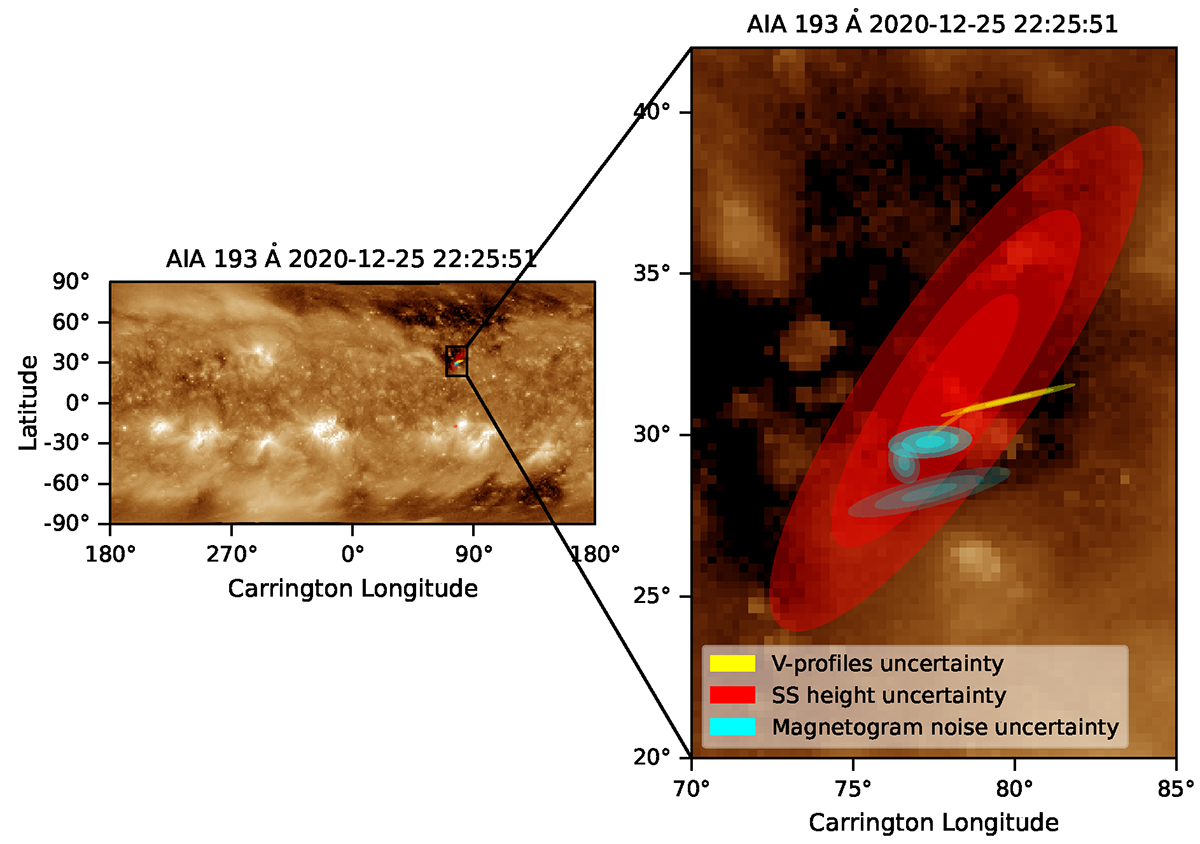
Fig. 9.
Download original image
Confidence areas for the source region of the solar wind derived for different sources of uncertainty. (Left) The synoptic AIA 193 Å map corresponding to Event 1. The black box indicates the area of interest. (Right) A zoom-in of the area of interest. The colored ellipses display the confidence area in the back-mapped position (on the solar surface) of the in situ solar wind for different sources of uncertainty. The color of each ellipse denotes the uncertainty source responsible (as indicated in the legend) and the transparency the 1–3 sigma area, with the 1 sigma being less transparent. These confidence area results correspond to in situ point number 10 of Event 1.
Current usage metrics show cumulative count of Article Views (full-text article views including HTML views, PDF and ePub downloads, according to the available data) and Abstracts Views on Vision4Press platform.
Data correspond to usage on the plateform after 2015. The current usage metrics is available 48-96 hours after online publication and is updated daily on week days.
Initial download of the metrics may take a while.