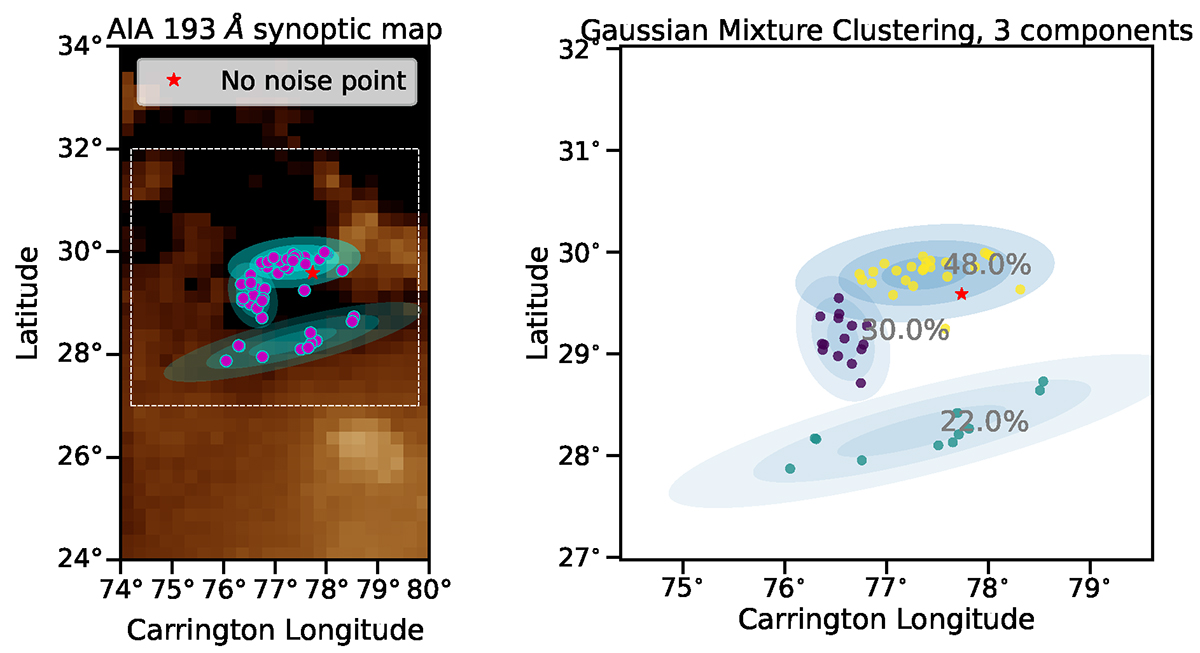
Fig. 8.
Download original image
Back-mapped points on the solar surface derived from varying the noise in the input magnetogram for in situ point number 10 of Event 1. (Left) The back-mapped points (purple circles) are plotted on a zoom-in of the synoptic AIA 193 Å map. The point with the red star represents the back-mapped point without noise in the input magnetogram. The white dashed box delimits the area that is enlarged in the right panel (without the EUV background image). (Right) Gaussian Mixture clustering of the back-mapped solar surface points from the Monte Carlo simulation. Here the optimal number of cluster was found to be 3. The light blue ellipses represent the confidence intervals of each cluster and next to them the probability of connection to each cluster is displayed. The level of transparency of each ellipse displays the variance interval they portrait, meaning the least transparent represents the 1σ confidence interval and the more transparent the 3σ confidence interval. These are also overplotted in the left panel.
Current usage metrics show cumulative count of Article Views (full-text article views including HTML views, PDF and ePub downloads, according to the available data) and Abstracts Views on Vision4Press platform.
Data correspond to usage on the plateform after 2015. The current usage metrics is available 48-96 hours after online publication and is updated daily on week days.
Initial download of the metrics may take a while.