Open Access
Fig. 7.
Download original image
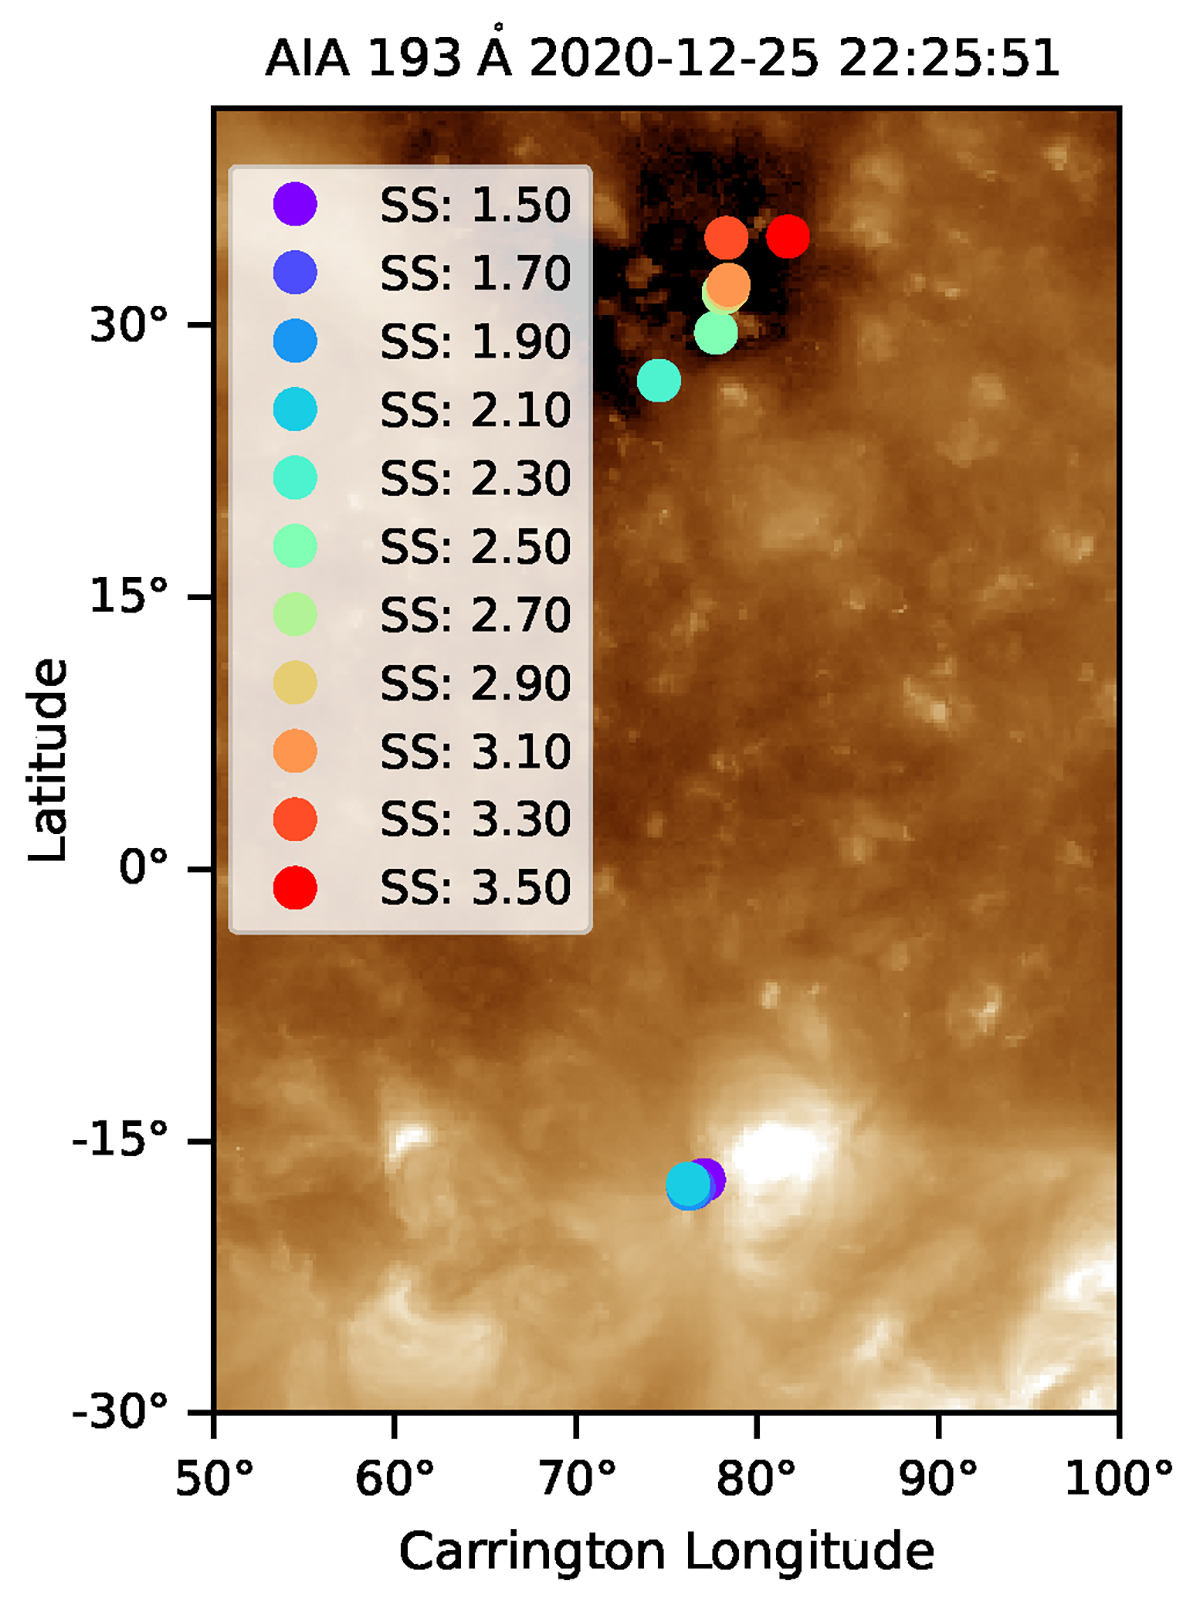
Back-mapped points on the solar surface derived from varying the SS height for in situ point number 10 of Event 1. The points are plotted on a zoom-in of the synoptic AIA 193 Å map as background. The color of the solar surface points represents the SS height that was used during their magnetic mapping.
Current usage metrics show cumulative count of Article Views (full-text article views including HTML views, PDF and ePub downloads, according to the available data) and Abstracts Views on Vision4Press platform.
Data correspond to usage on the plateform after 2015. The current usage metrics is available 48-96 hours after online publication and is updated daily on week days.
Initial download of the metrics may take a while.