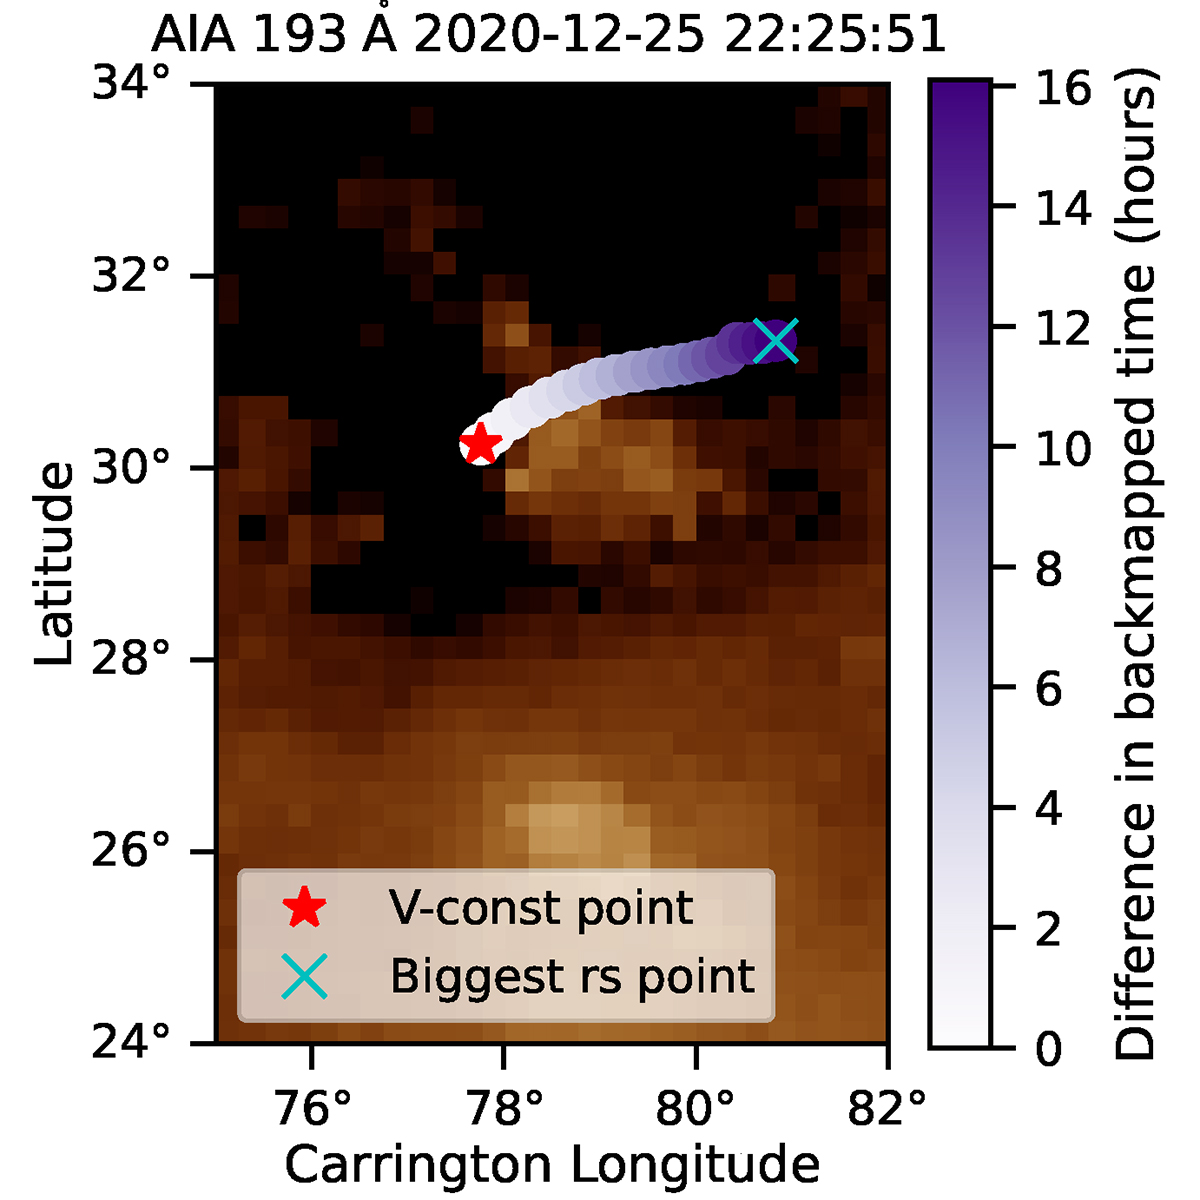
Fig. 6.
Download original image
Back-mapped points on the solar surface derived from the velocity profiles analysis for in situ point number 10 of Event 1. The background is a zoom-in of a synoptic AIA 193 Å map and their color represents the difference in their back-mapped time compared to the constant speed point (smallest travel time; red star). The point derived from the largest-rs solar wind velocity profile (upper boundary on the travel time) is shown with a cross.
Current usage metrics show cumulative count of Article Views (full-text article views including HTML views, PDF and ePub downloads, according to the available data) and Abstracts Views on Vision4Press platform.
Data correspond to usage on the plateform after 2015. The current usage metrics is available 48-96 hours after online publication and is updated daily on week days.
Initial download of the metrics may take a while.