Fig. 4.
Download original image
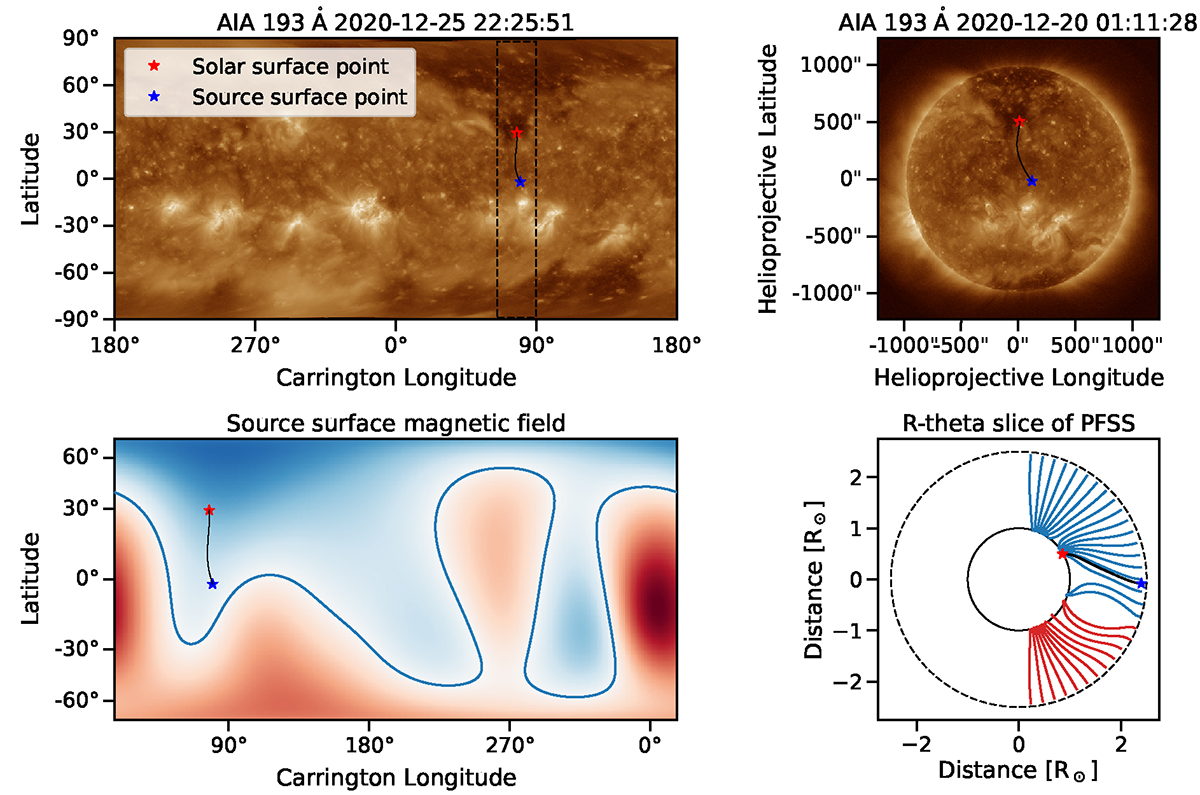
Overview plot of the back-mapping for a single in situ point (point number 10 of Event 1). The computed SS point is represented with a blue star and the solar surface point with a red start for all the plots. The magnetic field line that connects the two points is displayed as a black line. (Top left) AIA 193 Å synoptic map. (Top right) AIA 193 Å full disk image at the time of the back-mapping. This image is the most accurate representation of the solar atmosphere at the time that is indicated with the dashed line box in the synoptic map. (Bottom left) The radial magnetic field at the SS height. The blue line indicates the polarity inversion line and the colored regions the different polarities. (Bottom right) An R-theta slice of the 3D magnetic field that was computed from the PFSS extrapolation; the inner circle (solid black line) represents the solar surface and the outer circle (dashed line) the SS, the blue and red line represent the magnetic field lines with different polarities.
Current usage metrics show cumulative count of Article Views (full-text article views including HTML views, PDF and ePub downloads, according to the available data) and Abstracts Views on Vision4Press platform.
Data correspond to usage on the plateform after 2015. The current usage metrics is available 48-96 hours after online publication and is updated daily on week days.
Initial download of the metrics may take a while.