Fig. 2.
Download original image
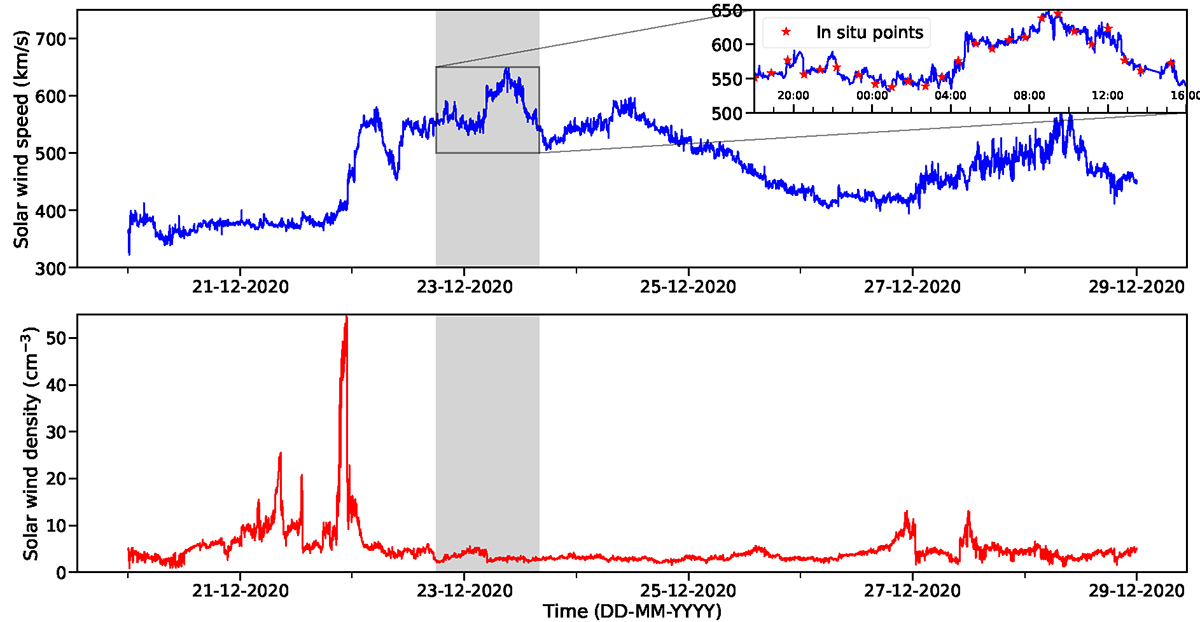
Overview of the in situ speed and density measurements for the case-study high-speed stream (Event 1) analyzed in this study. (Top) In situ solar wind speed by WIND. (Bottom) In situ solar wind density. The shaded area in both plots represents the high-speed interval that was used during the analysis (Event 1). (Inset) The zoomed-in view of the selected high-speed interval. The red star markers represent the in situ speed measurements that were back-mapped to the solar surface and examined in more detail.
Current usage metrics show cumulative count of Article Views (full-text article views including HTML views, PDF and ePub downloads, according to the available data) and Abstracts Views on Vision4Press platform.
Data correspond to usage on the plateform after 2015. The current usage metrics is available 48-96 hours after online publication and is updated daily on week days.
Initial download of the metrics may take a while.