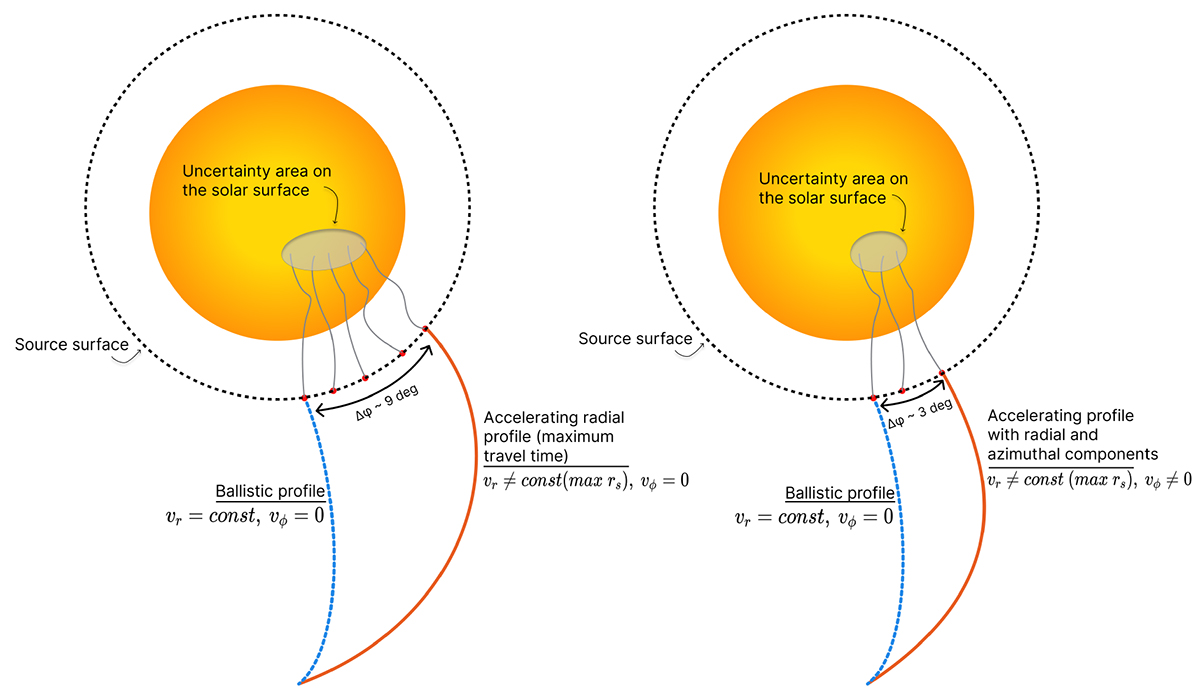
Fig. A.2.
Download original image
Cartoon representing the effect in the uncertainty area on the solar surface, if corotation effects above the SS are taken into consideration. The longitudinal spread of back-mapped points at the SS is determined by the location of the ballistically back-mapped point and that of an accelerating velocity profile with the largest travel time (i.e., a profile which produces the largest offset at the SS). In both illustrations the location of the ballistically back-mapped point at the SS is given by the dashed blue line. In the illustration on the left, the back-mapped location at the SS with the largest longitudinal offset is given by an accelerating velocity profile, derived from the family of hybrid profiles presented in Sect. 2.4.1 and for the largest rs value that produces a velocity profile compatible with remote sensing observations. In the illustration on the right, the location at the SS of the back-mapped point with the largest longitudinal offset is given by an accelerating profile that has both a radial and an azimuthal component. The radial component is the same as the schematic on the left and the azimuthal component is derived from the Weber & Davis (1967) model as discussed in Sect. 3 and in the Appendix. It is noteworthy that the longitudinal spread of back-mapped points at the SS is reduced when an azimuthal component is added to the accelerating velocity profile. Furthermore, this reduced longitudinal spread is included in that computed when considering velocity profiles without an azimuthal component. Consequently, the uncertainty area on the solar surface, computed after tracing the field lines that connect the points back-mapped at the SS to the solar surface, will also reduce. This simple cartoon represents more closely the case of a coronal hole with super-radial expansion (similar to the main morphology of the events in our study), but the reduction in the uncertainty area on the solar surface should be in principle independent of the magnetic field topology. The reason for this is that the longitude locations (of the back-mapped points at the SS) when we consider an azimuthal component are a subset of the ones when we consider only a radial component.
Current usage metrics show cumulative count of Article Views (full-text article views including HTML views, PDF and ePub downloads, according to the available data) and Abstracts Views on Vision4Press platform.
Data correspond to usage on the plateform after 2015. The current usage metrics is available 48-96 hours after online publication and is updated daily on week days.
Initial download of the metrics may take a while.