Fig. 13.
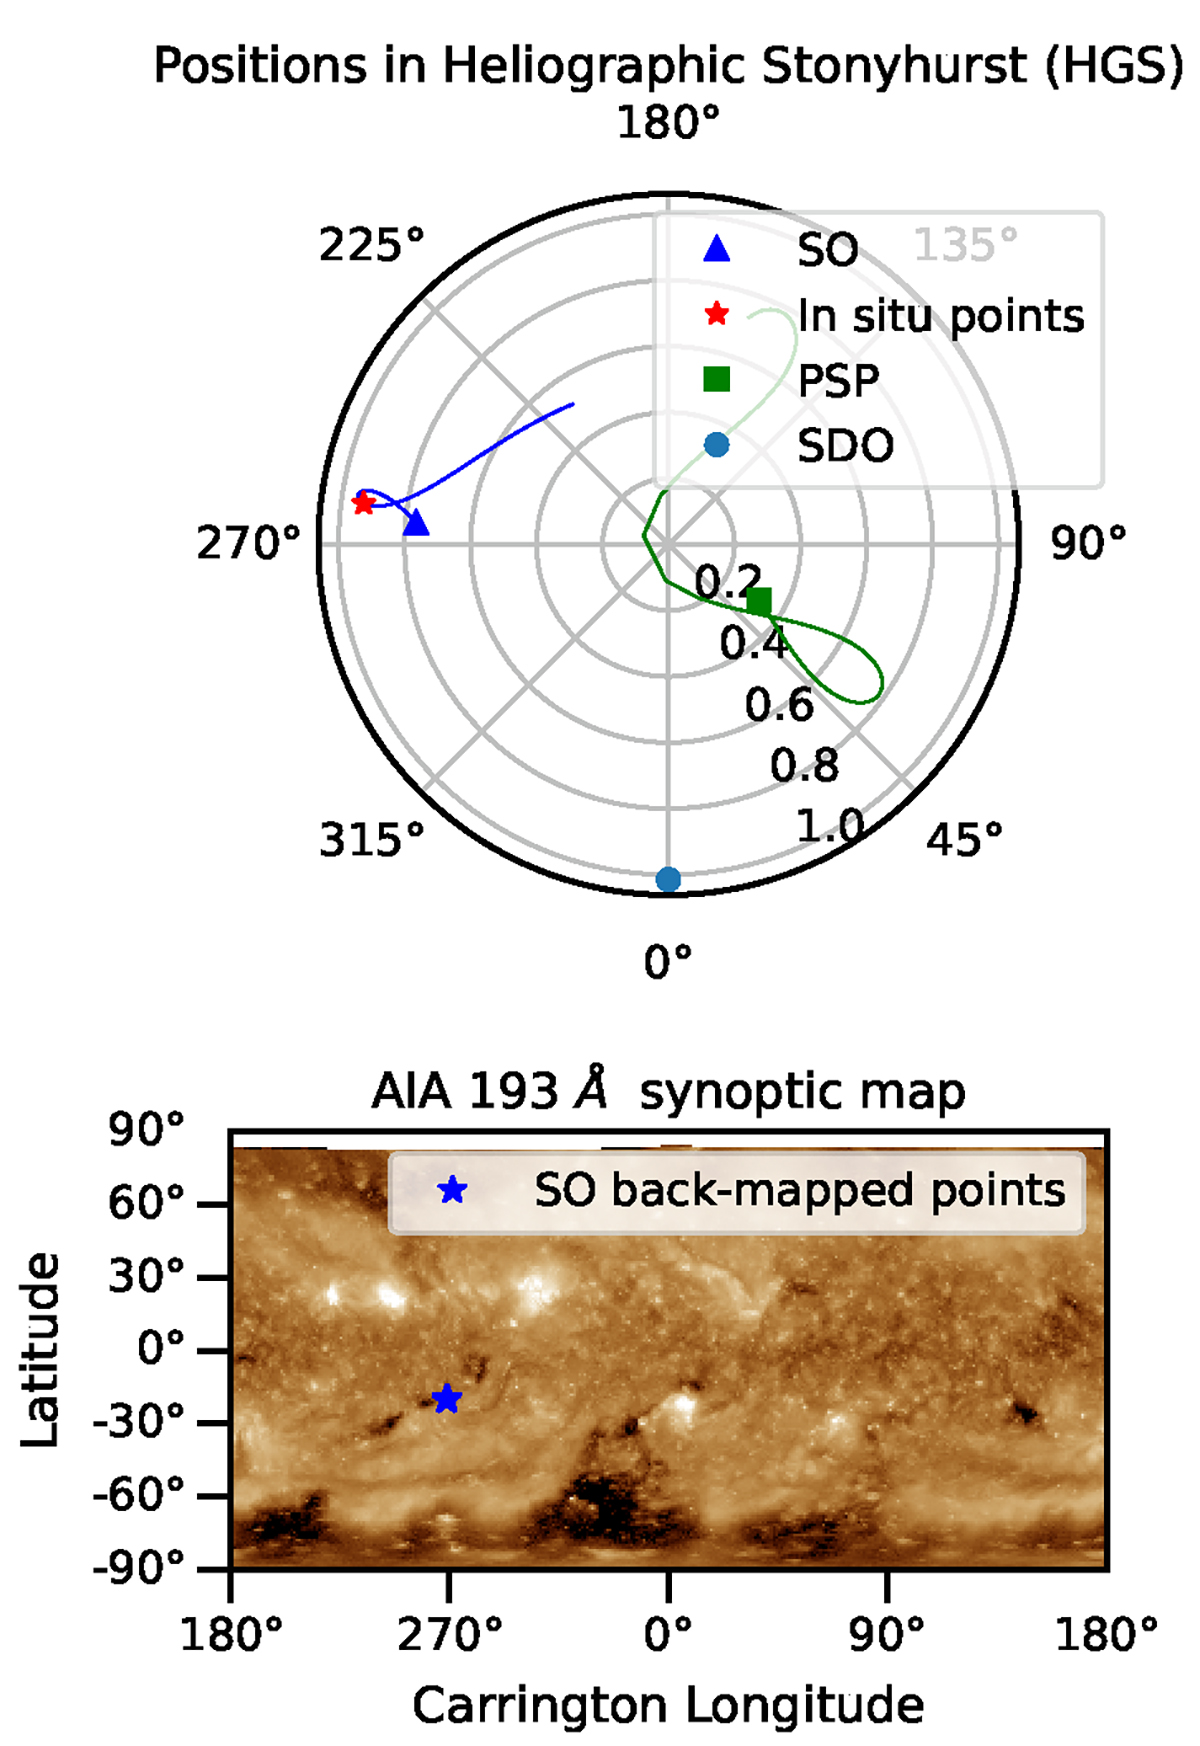
Download original image
Back-mapping example for Solar Orbiter data. (Top) Solar Orbiter orbit (blue line) in the Heliographic Stonyhurst frame together with the orbit of Parker Solar Probe and the location of the Solar Dynamic Observatory. The orbits have been plotted within ±80 days around the time of the high-speed stream observed in Solar Orbiter. (Bottom) Back-mapped points from the high-speed stream that was observed from Solar Orbiter on 13/05/2021 (blue stars), the background is the AIA 193 Å synoptic map.
Current usage metrics show cumulative count of Article Views (full-text article views including HTML views, PDF and ePub downloads, according to the available data) and Abstracts Views on Vision4Press platform.
Data correspond to usage on the plateform after 2015. The current usage metrics is available 48-96 hours after online publication and is updated daily on week days.
Initial download of the metrics may take a while.