Fig. 12.
Download original image
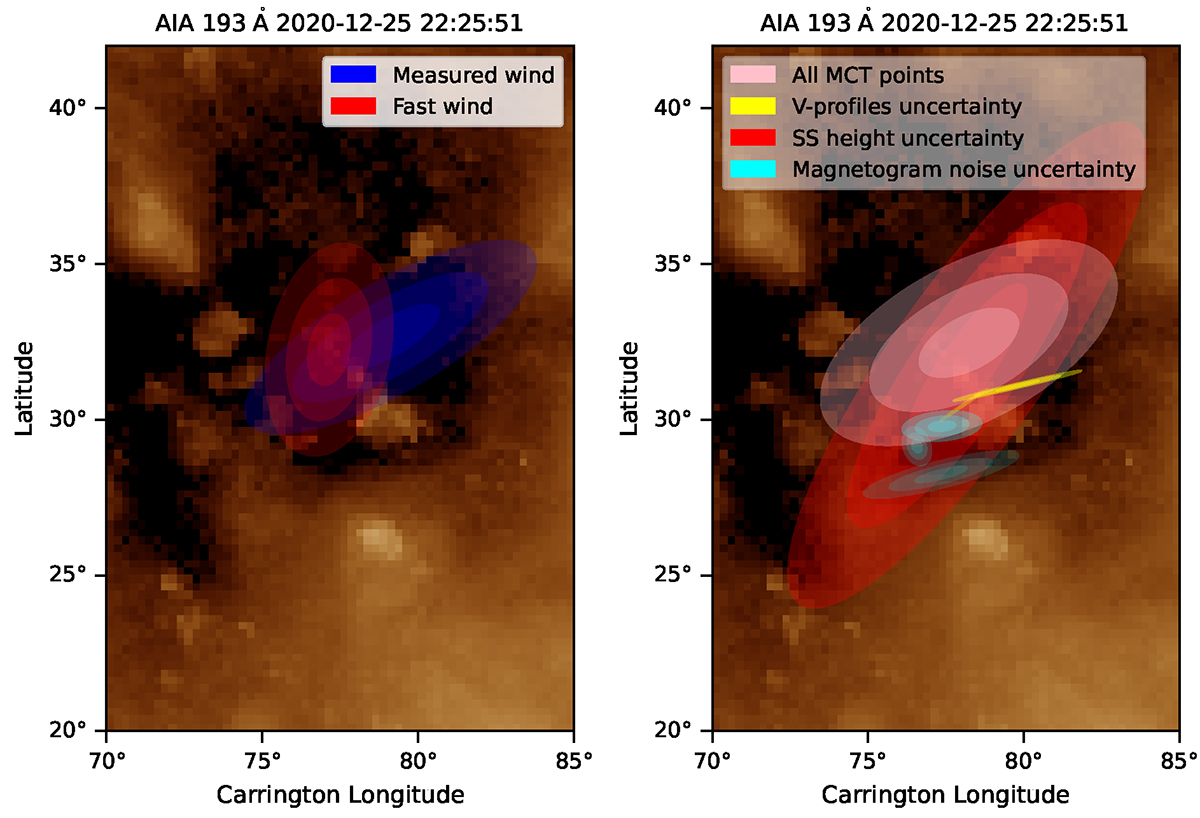
Uncertainty area of the solar wind source region after clustering the MCT results for in situ point 10 of Event 1. The background is a zoom-in of the synoptic AIA 193 Å map that corresponds to this observation. (Left) The uncertainty area for the measured solar wind data is indicated with blue and the uncertainty area for the fixed solar wind values is indicated with red. (Right) The uncertainty area of both fast and measured solar wind combined is indicated with the hatched pattern ellipse, superimposed on our own uncertainty areas for each source, as shown in Fig. 9.
Current usage metrics show cumulative count of Article Views (full-text article views including HTML views, PDF and ePub downloads, according to the available data) and Abstracts Views on Vision4Press platform.
Data correspond to usage on the plateform after 2015. The current usage metrics is available 48-96 hours after online publication and is updated daily on week days.
Initial download of the metrics may take a while.