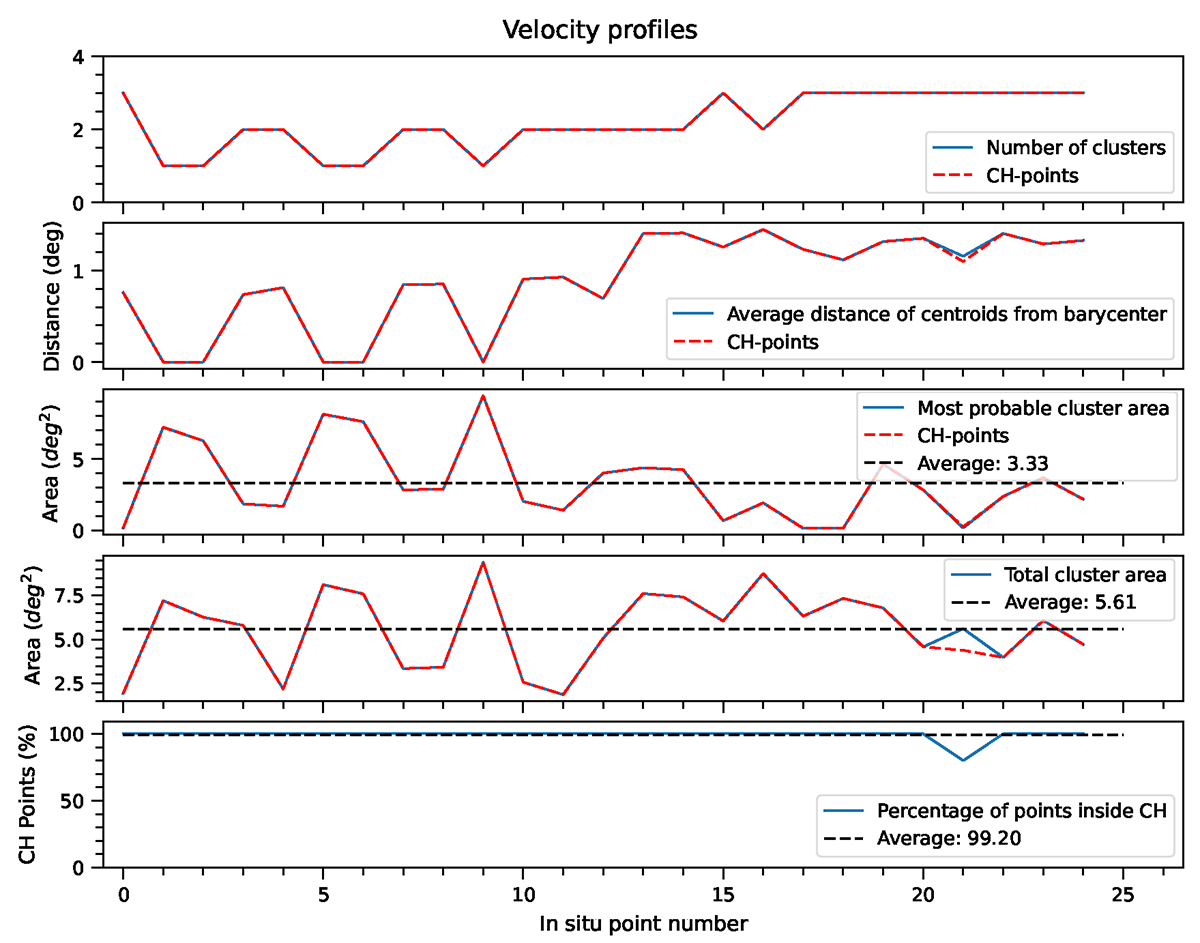
Fig. 10.
Download original image
Evolution of four metrics that we use to assess the quality of our back-mapping for all the in situ points of Event 1, focusing on the uncertainty derived from the different solar wind velocity profiles. The horizontal axis indicates the in situ points number (selected solar wind measurements) of the Event 1 high-speed stream, as indicated previously in the inset plot of Fig. 2 (red stars markers). From top to bottom: the optimal number of clusters that was found, the average distance of each cluster centroid to the barycenter of the clusters, the uncertainty area of the most probable cluster, the total uncertainty area, and the percentage of the back-mapped points that ended up inside the coronal hole (as identified from the AIA 193 Å passband). For the first 4 metrics we present the values calculated for all the back-mapped points, as indicated with the blue line, and the values for only the back-mapped points that are located inside the coronal hole, as the dashed red line.
Current usage metrics show cumulative count of Article Views (full-text article views including HTML views, PDF and ePub downloads, according to the available data) and Abstracts Views on Vision4Press platform.
Data correspond to usage on the plateform after 2015. The current usage metrics is available 48-96 hours after online publication and is updated daily on week days.
Initial download of the metrics may take a while.