Fig. 5
Download original image
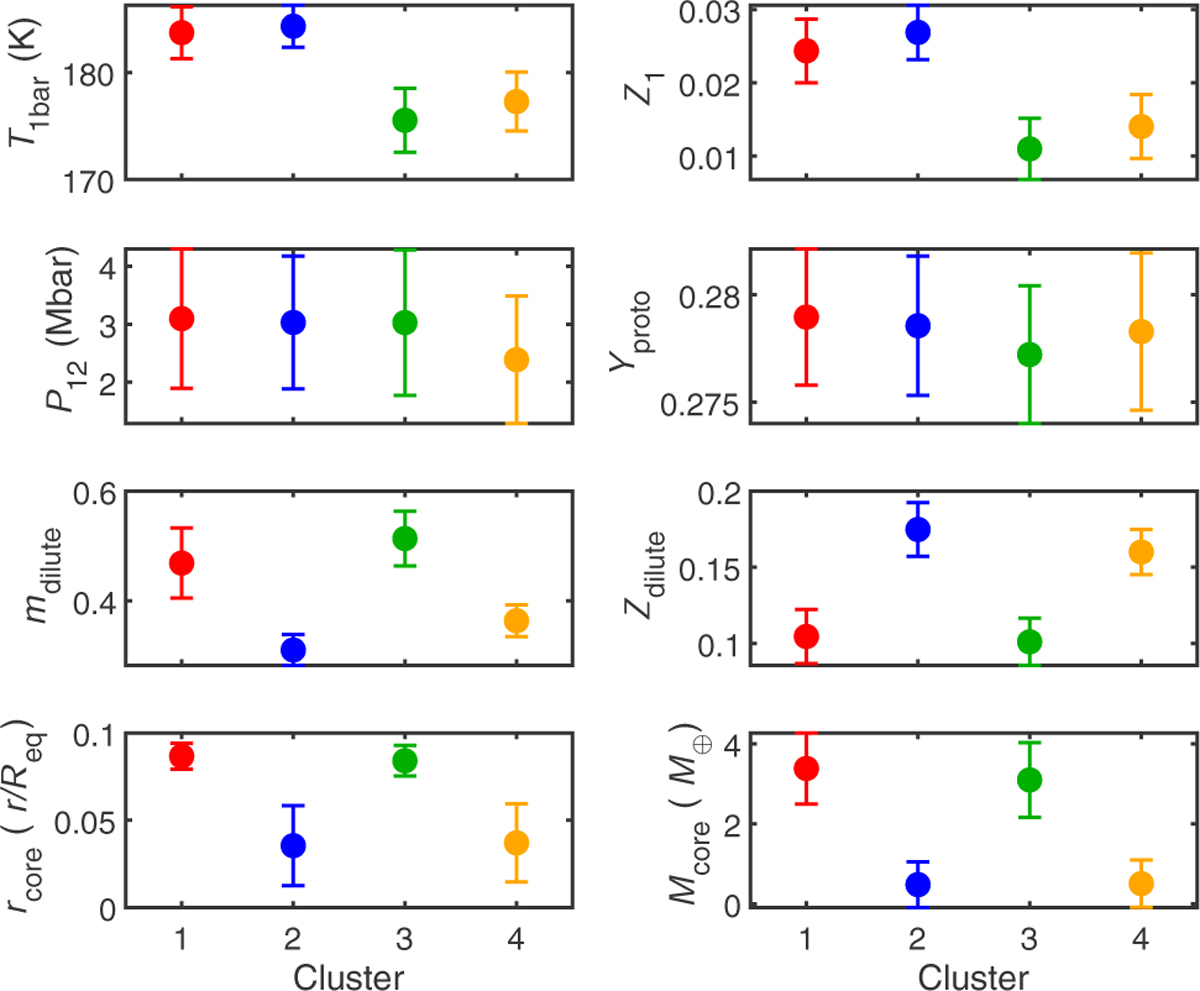
Interior parameters’ means (points) and standard deviations (error bars) within the four clusters, shown in different colors. Clusters 1 and 2 (red and blue) show high values of T1bar and Z1, while clusters 3 and 4 (green and yellow) show lower values of these parameters. Clusters 1 and 3 feature high values of mdilute and rcore, and low values of Zdilute, whereas clusters 2 and 4 display the opposite trend. We note that the compact core mass, Mcore, was not used in the clustering analysis.
Current usage metrics show cumulative count of Article Views (full-text article views including HTML views, PDF and ePub downloads, according to the available data) and Abstracts Views on Vision4Press platform.
Data correspond to usage on the plateform after 2015. The current usage metrics is available 48-96 hours after online publication and is updated daily on week days.
Initial download of the metrics may take a while.