Fig. 2
Download original image
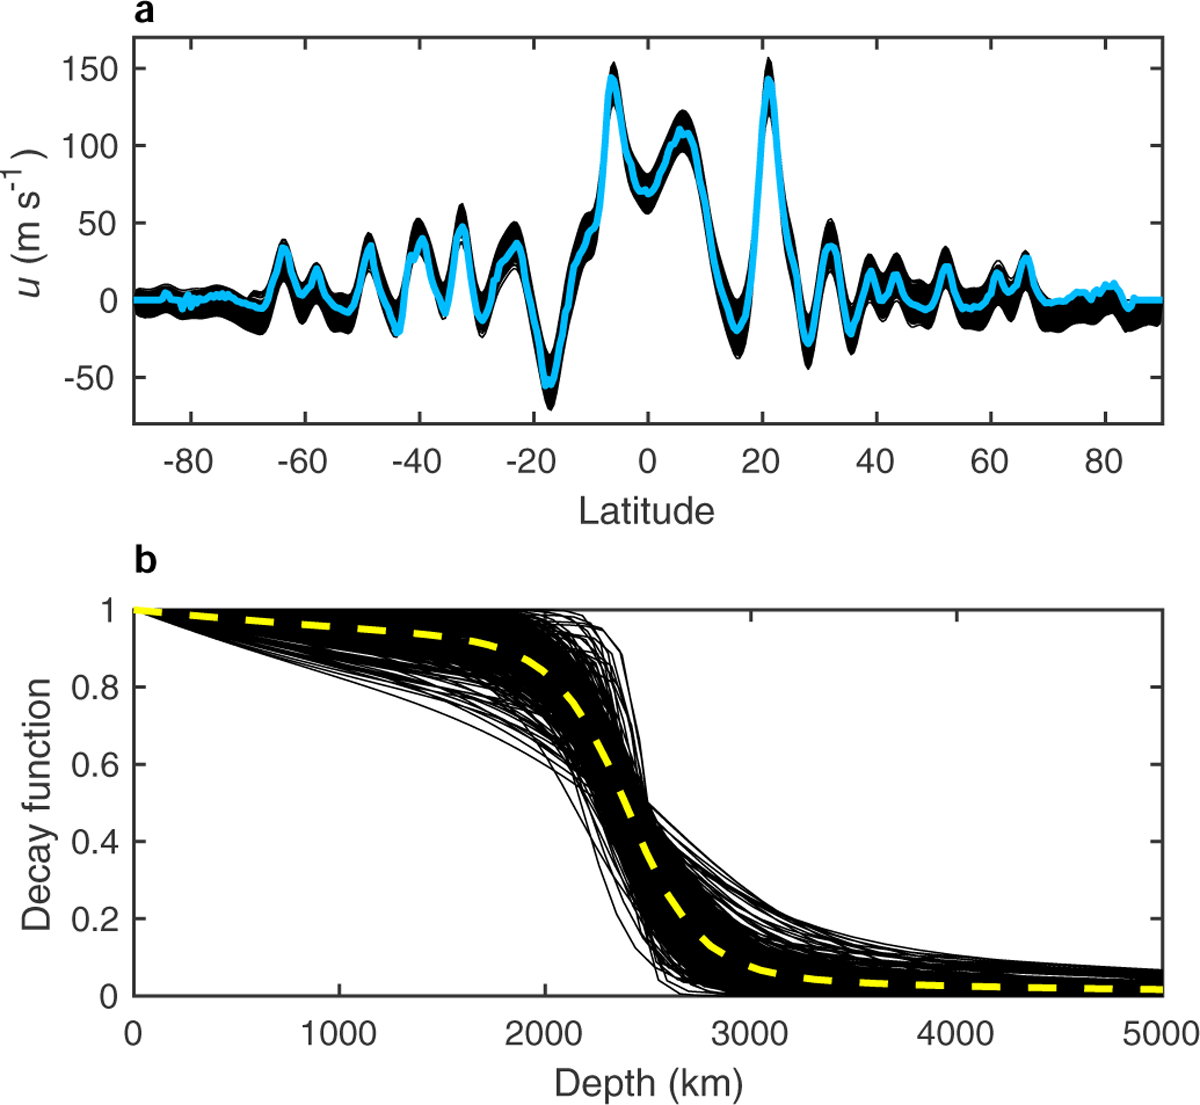
Optimized wind solutions for all models accepted by the wind criteria (Table 1). Panel a: latitudinal cloud-level wind profiles. Panel b: the radial decay function with depth. The blue profile represents the observed cloud-level wind (Tollefson et al. 2017), and the dashed yellow profile indicates the mean of all decay profiles.
Current usage metrics show cumulative count of Article Views (full-text article views including HTML views, PDF and ePub downloads, according to the available data) and Abstracts Views on Vision4Press platform.
Data correspond to usage on the plateform after 2015. The current usage metrics is available 48-96 hours after online publication and is updated daily on week days.
Initial download of the metrics may take a while.