Fig. 7.
Download original image
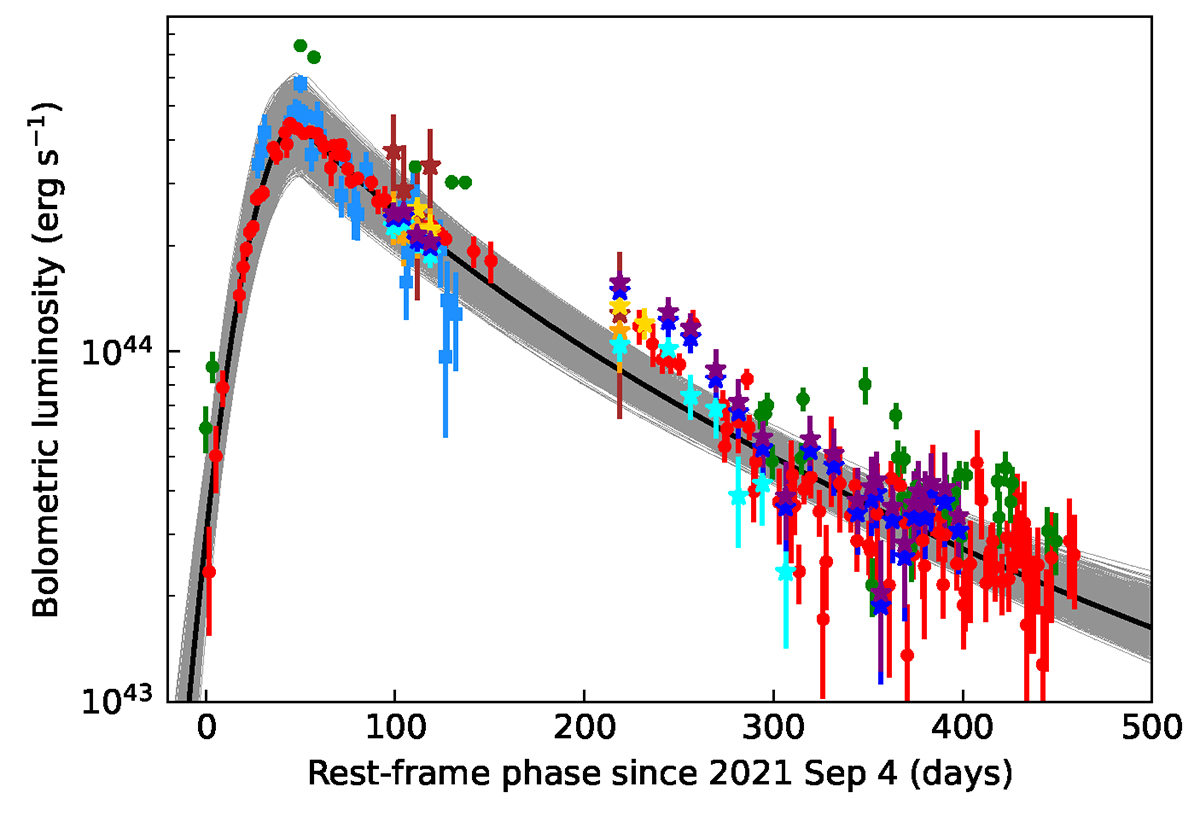
MCMC realisations of bolometric LCs (grey) and their median LC (black). We show the observed data (colours the same as in Fig. 5) after bolometric corrections for comparison. The data in the ATLAS/c band (rest-frame 4840 Å) show excess relative to the models, possibly due to broad He II and Hβ emission lines (see Sect. 3.3 for details).
Current usage metrics show cumulative count of Article Views (full-text article views including HTML views, PDF and ePub downloads, according to the available data) and Abstracts Views on Vision4Press platform.
Data correspond to usage on the plateform after 2015. The current usage metrics is available 48-96 hours after online publication and is updated daily on week days.
Initial download of the metrics may take a while.