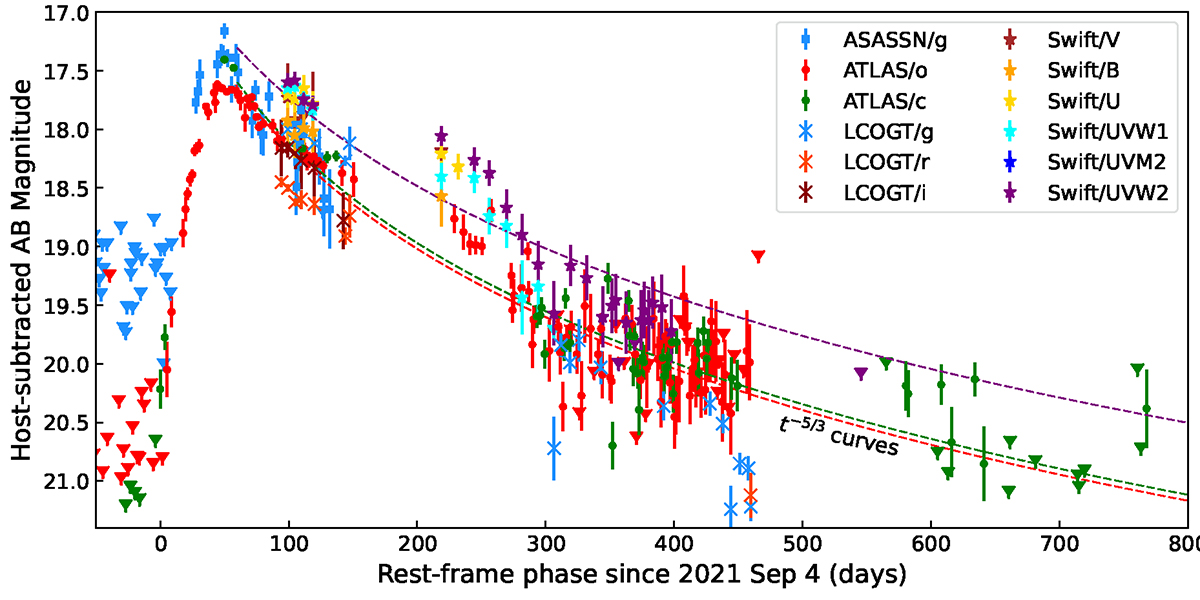
Fig. 5.
Download original image
Host-subtracted LCs of the 2021 flare. The observation time was converted to phase relative to the discovery date in the rest frame. For clarity, we did not show the upper limits from ASASSN/g observations after +200 days or those from ATLAS/c observations after +500 days, and binned the LCOGT data weekly. We show the t−5/3 curves that fit the data in UVW2, c, and o bands after +60 days in dashed lines for comparison.
Current usage metrics show cumulative count of Article Views (full-text article views including HTML views, PDF and ePub downloads, according to the available data) and Abstracts Views on Vision4Press platform.
Data correspond to usage on the plateform after 2015. The current usage metrics is available 48-96 hours after online publication and is updated daily on week days.
Initial download of the metrics may take a while.