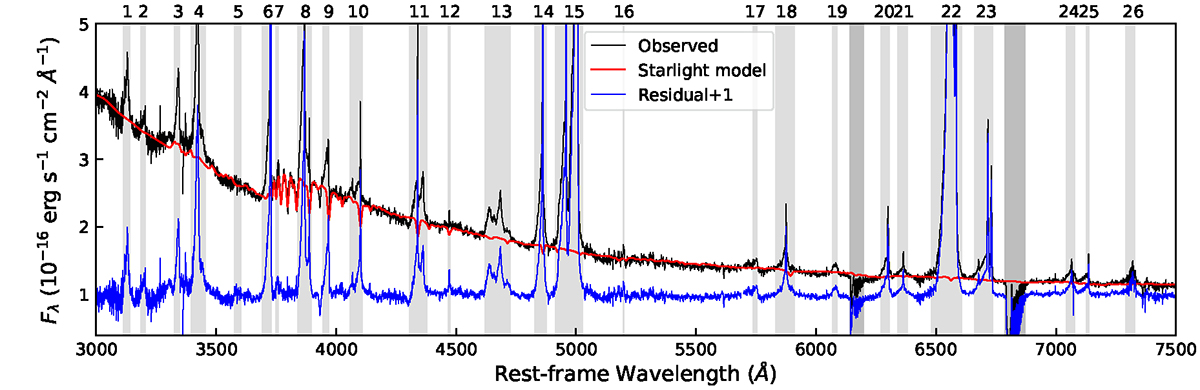
Fig. B.1.
Download original image
Best-fitting stellar model in the pre-flare spectrum. The grey shades label the emission lines identified by us. These are: 1. O III λλ3121,3132; 2. He I λ3189; 3. [Ne V] λ3346; 4. [Ne V] λ3426; 5. [Fe VII] λ3586; 6. [O II] λλ3726,3729; 7. [Fe VII] λ3759; 8. [Ne III] λ3869 + He I λ3889; 9. [Ne III] λ3968 + Hϵ; 10. [S II] λ4076 + Hδ; 11. Hγ + [O III] λ4363; 12. He I λ4471; 13. N III λ4640 + He II λ4686; 14. Hβ; 15. [O III] λλ4959,5007; 16. [N I] λ5199; 17. [Fe VII] λ5722 + [Fe II]λ5750??; 18. He I λ5876; 19. [Fe VII] λ6087; 20. [O I] λ6300; 21. [O I] λ6364 + [Fe X] λ6376; 22. Hα + [N II] λ6548,6583; 23. He I λ6679 + [S II] λλ6716,6731; 24. He I λ7065; 25. [Ar III] λ7136; 26. [O II] λλ7320,7330. The dark grey shades label the regions affected by strong telluric absorption lines, which were not included in the fitting.
Current usage metrics show cumulative count of Article Views (full-text article views including HTML views, PDF and ePub downloads, according to the available data) and Abstracts Views on Vision4Press platform.
Data correspond to usage on the plateform after 2015. The current usage metrics is available 48-96 hours after online publication and is updated daily on week days.
Initial download of the metrics may take a while.