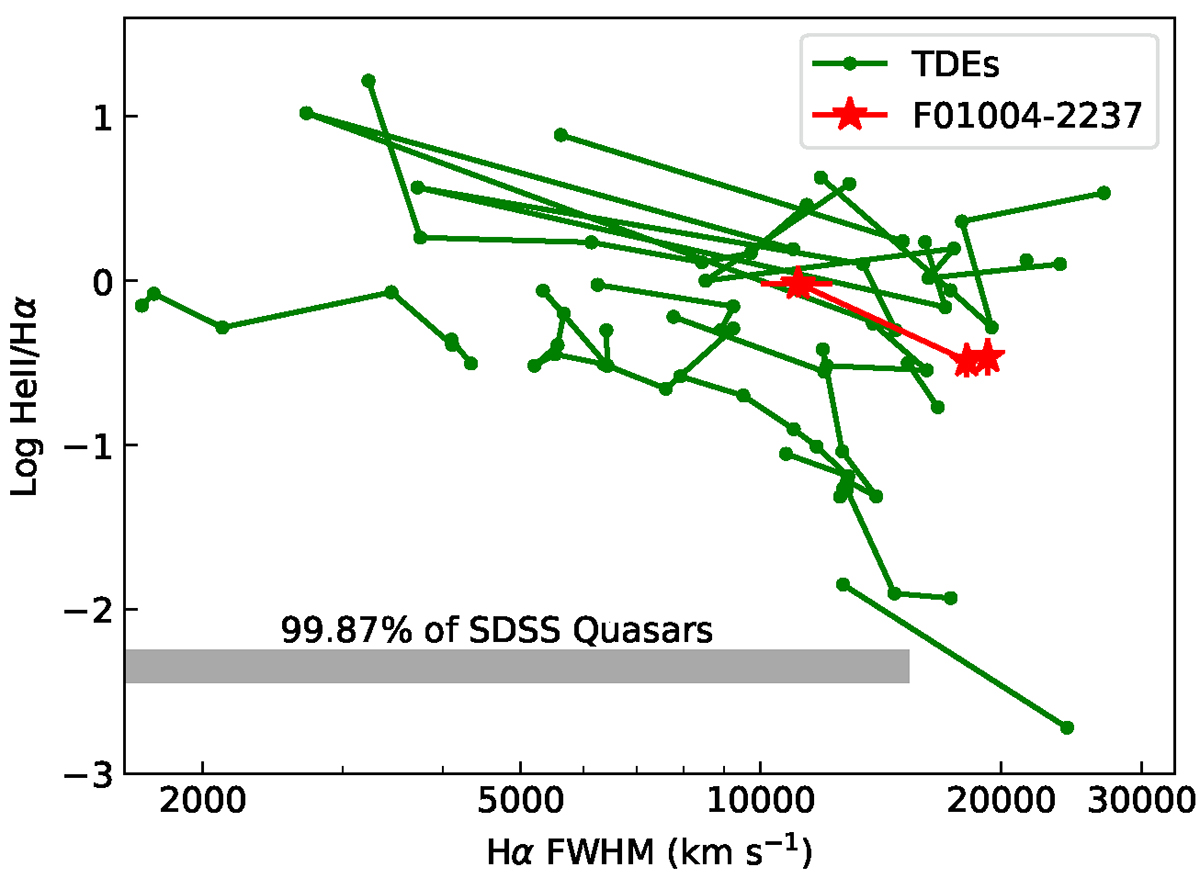
Fig. 13.
Download original image
Comparison of the Hα FWHM and He II/Hα ratio of the 2021 flare with those of TDEs (Charalampopoulos et al. 2022) and quasars. For the 2021 flare, we show the values assuming that the flare’s continuum is a third-order polynomial, and the values are located in the TDE region in this figure. If the results by assuming other continuum model are adopted, the values will still be in this region. We present the range of Hα FWHMs of 99.87% of SDSS DR7 quasars from Shen et al. (2011) and the averaged He II/Hα ratio of SDSS early data release quasars from Vanden Berk et al. (2001).
Current usage metrics show cumulative count of Article Views (full-text article views including HTML views, PDF and ePub downloads, according to the available data) and Abstracts Views on Vision4Press platform.
Data correspond to usage on the plateform after 2015. The current usage metrics is available 48-96 hours after online publication and is updated daily on week days.
Initial download of the metrics may take a while.