Open Access
Fig. 10.
Download original image
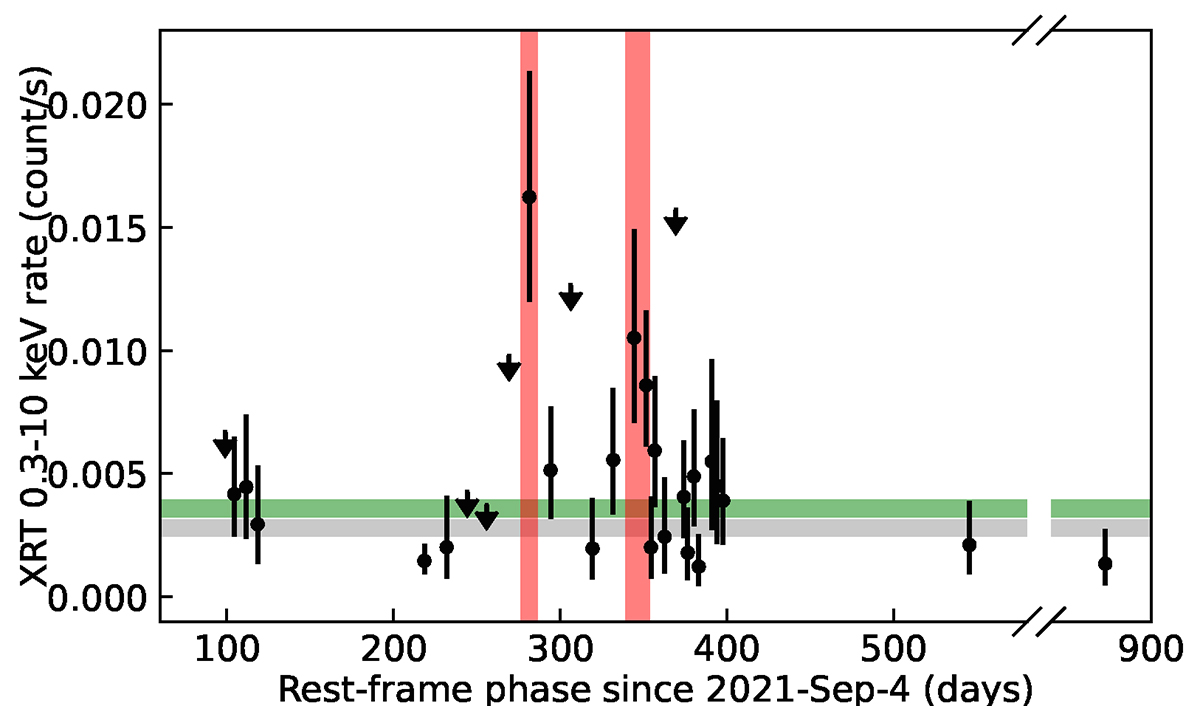
XRT net count rates in 0.3–10 keV. The two X-ray flares are indicated by red shades. The averaged count rate (with 1σ error) of all 29 observations and that of the other 26 are indicated by green and grey shades, respectively.
Current usage metrics show cumulative count of Article Views (full-text article views including HTML views, PDF and ePub downloads, according to the available data) and Abstracts Views on Vision4Press platform.
Data correspond to usage on the plateform after 2015. The current usage metrics is available 48-96 hours after online publication and is updated daily on week days.
Initial download of the metrics may take a while.