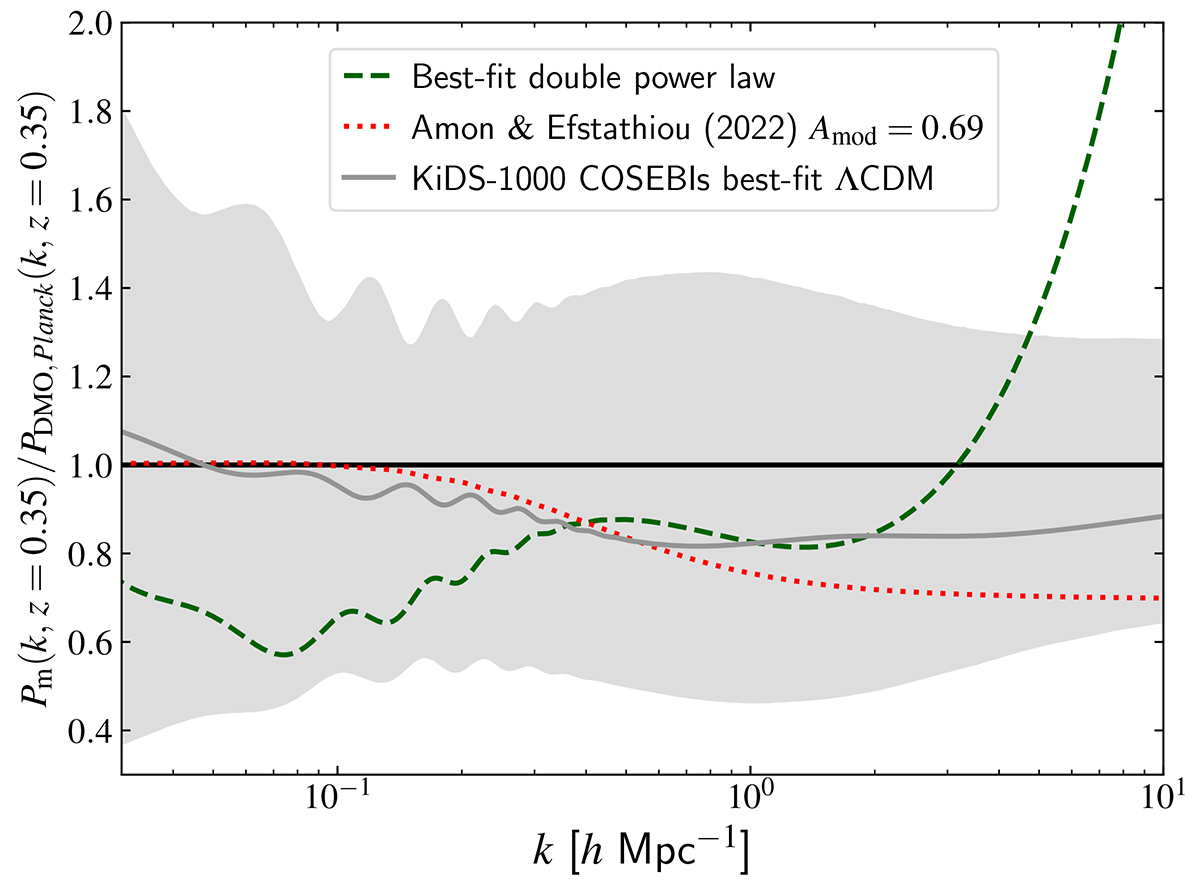
Fig. 4.
Download original image
Suppression of the matter power spectrum compared to a DMO prediction at z = 0.35. The dashed green curve corresponds to the best-fitting prediction from the double power law model to the KiDS COSEBIs with AIA = 1. The solid gray curve shows the best fit of the KiDS-1000 ΛCDM inference from Asgari et al. (2021), and the shaded area covers the 16th to 84th percentile region. The dotted red curve uses the parametric model from Amon & Efstathiou (2022) with Amod = 0.69.
Current usage metrics show cumulative count of Article Views (full-text article views including HTML views, PDF and ePub downloads, according to the available data) and Abstracts Views on Vision4Press platform.
Data correspond to usage on the plateform after 2015. The current usage metrics is available 48-96 hours after online publication and is updated daily on week days.
Initial download of the metrics may take a while.