Fig. 9.
Download original image
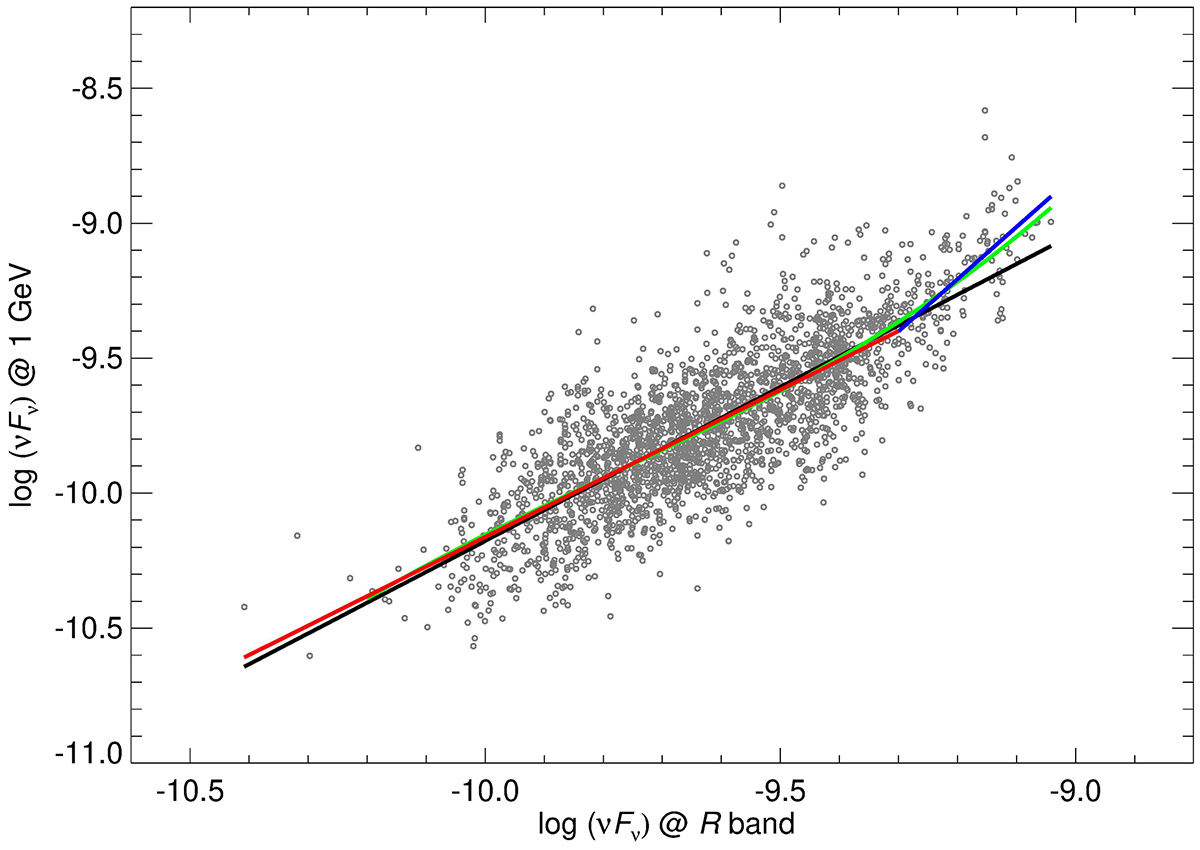
γ-ray fluxes at 1 GeV versus optical fluxes in R band. Each data point of γ-ray light curve has been paired with the average of the optical points acquired within 6 h. Solid lines represent linear regressions to the whole dataset (black), to the data points with optical log(ν Fν) less than −9.3 (red), and to the data points with optical log(ν Fν) greater than −9.3 (blue). The green line represents a cubic regression.
Current usage metrics show cumulative count of Article Views (full-text article views including HTML views, PDF and ePub downloads, according to the available data) and Abstracts Views on Vision4Press platform.
Data correspond to usage on the plateform after 2015. The current usage metrics is available 48-96 hours after online publication and is updated daily on week days.
Initial download of the metrics may take a while.